.png)
Profiles
Nearby Suburbs
Real Estate Market: Is Repton NSW 2454 a Good Suburb to Buy Into?
Housing Market in Repton

Sources: Property Listings, TORREN and Microburbs, 2002 - 2023
| Field | Value | VS Coffs Harbour | Trend | |
|---|---|---|---|---|
| Premium | Premium | Premium | ||
| Premium | Premium | Premium | ||
| Premium | Premium | Premium | ||
| $682 | Top 26% |
|
||
| Premium | Premium | Premium |
Housing Supply in Repton

The higher the supply score the more supply is on the market, both current and future.
Sources: ABS, GEOSPATIAL, Property Listings, PLANNING ALERTS, BASIX and Microburbs, 2002 - 2031
Sources: ABS, GEOSPATIAL, Property Listings, PLANNING ALERTS, BASIX and Microburbs, 2002 - 2031
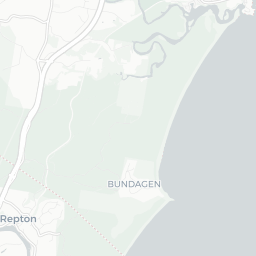
Repton
38.3%
Repton
38.3%
Coffs Harbour
33.4%
Coffs Harbour
33.4%
| Field | Value | VS Coffs Harbour | Trend | |
|---|---|---|---|---|
| 1,230 | Top 4% |
|
||
| 1.8 | Bottom 38% | Data for Jul 2023 | ||
| 70.6 | Top 8% | Data for May 2023 | ||
| Premium | Premium | Premium | ||
| Premium | Premium | Premium | ||
| 4 | Bottom 34% |
|
||
| Premium | Premium | Premium | ||
| Premium | Premium | Premium | ||
| Premium | Premium | Premium | ||
| 0 | Bottom 24% | Data for Feb 2025 |
Housing Stock Quality in Repton
The higher the score, the higher the quality of the houses and units.
Sources: ABS, GEOSPATIAL, Property Listings, BASIX and Microburbs, 2006 - 2023
Sources: ABS, GEOSPATIAL, Property Listings, BASIX and Microburbs, 2006 - 2023
| Field | Value | VS Coffs Harbour | Trend | |
|---|---|---|---|---|
| 94.5% | Bottom 26% |
|
||
| 2.5 | Top 48% | Data for Jan 2021 | ||
| 24.8% | Top 11% | Data for Jun 2023 | ||
| Premium | Premium | Premium |
Development Restrictions in Repton

The higher the score, the more easily density can be increased.
Sources: GEOSPATIAL, TORREN, ABS and Microburbs, 2011 - 2023
Sources: GEOSPATIAL, TORREN, ABS and Microburbs, 2011 - 2023
Repton
18.7%
Repton
18.7%
Coffs Harbour
30.4%
Coffs Harbour
30.4%
| Field | Value | VS Coffs Harbour | Trend | |
|---|---|---|---|---|
| 8.9 sq km | Top 48% | Data for Jan 2021 | ||
| 0.1% | Top 31% | Data for Jun 2023 | ||
| 7 | Top 20% | Data for Jun 2023 | ||
| 5200 sqm per resident | Top 25% | Data for Jan 2021 |
Risk in Repton

The higher the score, the more exposed households are to financial stress.
Sources: ABS, Property Listings, TORREN and Microburbs, 2006 - 2023
Sources: ABS, Property Listings, TORREN and Microburbs, 2006 - 2023
Repton
42.3
Repton
42.3
Coffs Harbour
47.0
Coffs Harbour
47.0
| Field | Value | VS Coffs Harbour | Trend | |
|---|---|---|---|---|
| 96.9% | Top 29% |
|
||
| 3.1% | Bottom 29% |
|
||
| 50 | Top 13% | Data for Jun 2023 | ||
| $2,210 | Top 34% |
|
||
| 69 | Bottom 11% | Data for Jun 2023 | ||
| 65 | Bottom 9% | Data for Jun 2023 | ||
| 26.9% | Top 26% |
|
||
| 42.5% | Top 39% |
|
Housing Demand in Repton
The higher the score, the more demand their is for housing in the area, both current and future.
Sources: ABS, TORREN, Property Listings and Microburbs, 2006 - 2030
Sources: ABS, TORREN, Property Listings and Microburbs, 2006 - 2030
Repton
45.7%
Repton
45.7%
Coffs Harbour
64.4%
Coffs Harbour
64.4%
| Field | Value | VS Coffs Harbour | Trend | |
|---|---|---|---|---|
| Premium | Premium | Premium | ||
| 4860 | Bottom 16% |
|
||
| 94200 | Top 30% |
|
||
| Premium | Premium | Premium | ||
| 13500 | Bottom 49% |
|
||
| Premium | Premium | Premium | ||
| Premium | Premium | Premium | ||
| Premium | Premium | Premium |
Unit Market in Repton
Sources: Property Listings and Microburbs, 2002 - 2023
| Field | Value | VS Coffs Harbour | Trend | |
|---|---|---|---|---|
| Premium | Premium | Premium | ||
| 71.8% | Bottom 40% |
|
LGA Details (1)
| Headline | Place | Datetime |
|---|---|---|
| Local government area | Bellingen |
Percent of Renters by Street (19)
| Percent of Renters | Street |
|---|---|
| 0.0% | Bailey St |
| 0.0% | Blackbutt Ave |
| 0.0% | Cabbage Tree Cl |
| 11.3% | Elk Ave |
| 17.8% | Forest Dr |
Turnover Rate by Street (19)
| Turnover rate | Street | Turnover Label | Turnover Years | Year |
|---|---|---|---|---|
| 100.0% | Bailey St | high turnover | Every 10.0 years (high turnover) | 2025 |
| 40.0% | Cabbage Tree Cl | very tightly held | Every 25.0 years (very tightly held) | 2025 |
| 66.7% | Joeliza Dr | quite tightly held | Every 15.0 years (quite tightly held) | 2025 |
| 44.4% | River St | very tightly held | Every 22.5 years (very tightly held) | 2025 |
| 53.6% | Lyon St | quite tightly held | Every 18.7 years (quite tightly held) | 2025 |
Planning Applications: Dwellings (7)
| Headline | Place | Date |
|---|---|---|
| Use of building as an expanded dwelling and an attached secondary dwelling, ancillary building works and carport. - Bellingen Shire Council DA2025/00486 | 56 Perrys Road Repton NSW 2454 | 18 Feb 2025 |
| Partial Demolition of Existing Dwelling. Alterations and Additions to Existing Dwelling (Linked Pavilion with Carport Under) - Bellingen Shire Council DA2024/00455 | 80 Tuckers Rock Road Repton NSW 2454 | 06 Nov 2024 |
| Continued Use of Single Story Dwelling and Single Story Secondary Dwelling and Related Landscaping following Demolition of Fire Damaged Walls of 2 Buildings (Main House and Garage). - Bellingen Shire Council DA2024/00421 | 99 Forest Drive Repton NSW 2454 | 26 Sep 2024 |
| Modification 4.55(1a) of Development Consent DA2022/00100 Granted for Alterations and Additions to Dwelling - change of floor plan and roof lift. Revised BFAR report and reduced BAL rating reduction, refer to architectural plans. - Bellingen Shire Council DA2024/00398 | 88 Forest Drive Repton NSW 2454 | 25 Jul 2024 |
| Change of Use to Convert Existing Shed into Expanded Dwelling - Bellingen Shire Council DA2024/00317 | 25 Joeliza Drive Repton NSW 2454 | 30 Jan 2024 |
Planning Applications: Other (6)
| Headline | Place | Date |
|---|---|---|
| Use of building as an expanded dwelling and an attached secondary dwelling, ancillary building works and carport. - Bellingen Shire Council DA2025/00486 | 56 Perrys Road Repton NSW 2454 | 18 Feb 2025 |
| Partial Demolition of Existing Dwelling. Alterations and Additions to Existing Dwelling (Linked Pavilion with Carport Under) - Bellingen Shire Council DA2024/00455 | 80 Tuckers Rock Road Repton NSW 2454 | 06 Nov 2024 |
| Continued Use of Single Story Dwelling and Single Story Secondary Dwelling and Related Landscaping following Demolition of Fire Damaged Walls of 2 Buildings (Main House and Garage). - Bellingen Shire Council DA2024/00421 | 99 Forest Drive Repton NSW 2454 | 26 Sep 2024 |
| Change of Use and Alterations and Additions to convert existing shed into 'Expanded Dwelling' consisting of a Bedroom and a Bathroom addition under the carport. - Bellingen Shire Council DA2023/00295 | 25 Joeliza Drive Repton NSW 2454 | 11 Nov 2023 |
| Demolition Works & Shed/Carport; - Bellingen Shire Council 2019/DA-00028 | 96 Mylestom Dr Repton NSW 2454 | 11 Mar 2019 |
Recently Sold Houses (100)
| Address | Price | Bedrooms | Bathrooms | Garage spaces | Date sold | Subdivisible into | Sale Type |
|---|---|---|---|---|---|---|---|
| 18 Tuckers Rock Rd | $850,000 | 3.0 | 2.0 | 2.0 | 25 Nov 2024 | 0 | On Market |
| 17 River St | $1,305,000 | 4.0 | 3.0 | 2.0 | 31 Oct 2024 | 0 | On Market |
| 88 Lyon St | $1,410,000 | 4.0 | 2.0 | 4.0 | 23 Oct 2024 | 0 | On Market |
| 88 Lyon St | Price Withheld | 4.0 | 2.0 | 4.0 | 23 Oct 2024 | 0 | On Market |
| 43 Perrys Rd | $931,000 | 3.0 | 1.0 | 2.0 | 09 Aug 2024 | 0 | On Market |
Accommodation Options (1)
| Name | Address |
|---|---|
| Bellinger River Tourist Park | 96 Mylestom Dr, Repton NSW 2454, Australia |
Median Unit Sale Prices by Street (1)
| Date | Median sale value | Street |
|---|---|---|
| 10 May 2024 | $770,000 | Repton Rd |
Median House Sale Prices by Street (100)
| Street | Date | Median sale value |
|---|---|---|
| Tuckers Rock Rd | 10 May 2024 | $1,080,000 |
| Perrys Rd | 10 May 2024 | $1,188,000 |
| Old Coast Rd | 06 Oct 2023 | $1,103,000 |
| Perrys Ln | 06 Oct 2023 | $902,400 |
| Mylestom Dr | 06 Oct 2023 | $695,000 |
Recent Rental Unit Listings (100)
| Address | Rent (per week) | Bedrooms | Bathrooms | Garage spaces | Date |
|---|---|---|---|---|---|
| 33 Tree Fern Cl | $440 | 1.0 | 1.0 | 1.0 | 29 Aug 2023 |
| 33 Tree Fern Cl | $440 | 1.0 | 1.0 | 1.0 | 29 Aug 2023 |
| 33 Tree Fern Cl | $440 | 1.0 | 1.0 | 1.0 | 25 Aug 2023 |
| 33 Tree Fern Cl | $440 | 1.0 | 1.0 | 1.0 | 25 Aug 2023 |
| 33 Tree Fern Cl | $440 | 1.0 | 1.0 | 1.0 | 25 Aug 2023 |
Recent Rental House Listings (100)
| Address | Rent (per week) | Bedrooms | Bathrooms | Garage spaces | Date | Subdivisible into |
|---|---|---|---|---|---|---|
| 20a Old Coast Rd | $420 | 1 | 1 | 1 | 28 Feb 2025 | 0 |
| 114 Forest Dr | $1,200 | 4 | 3 | 4 | 22 Dec 2023 | 0 |
| 114 Forest Dr | $1,200 | 4 | 3 | 4 | 22 Dec 2023 | 0 |
| 114 Forest Dr | $1,200 | 4 | 3 | 4 | 22 Dec 2023 | 0 |
| 114 Forest Dr | $1,200 | 4 | 3 | 4 | 22 Dec 2023 | 0 |
Recently Sold Units (100)
| Address | Price | Bedrooms | Bathrooms | Garage spaces | Date sold | Sale Type |
|---|---|---|---|---|---|---|
| 18 Tuckers Rock Rd | $850,000 | 25 Nov 2024 | On Market | |||
| 18 Tuckers Rock Rd | $850,000 | 25 Nov 2024 | On Market | |||
| 18 Tuckers Rock Rd | $850,000 | 25 Nov 2024 | On Market | |||
| 18 Tuckers Rock Rd | $850,000 | 25 Nov 2024 | On Market | |||
| 18 Tuckers Rock Rd | $850,000 | 25 Nov 2024 | On Market |
Loading entities ..