.png)
Profiles
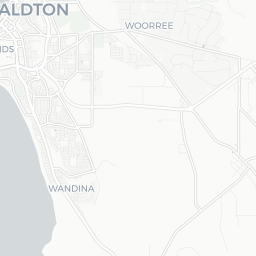
Nearby Suburbs
Real Estate Market: Is Rudds Gully WA 6532 a Good Suburb to Buy Into?
Housing Market in Rudds Gully

Sources: Property Listings and Microburbs, 2002 - 2023
| Field | Value | VS Regional WA | Trend | |
|---|---|---|---|---|
| Premium | Premium | Premium | ||
| Premium | Premium | Premium | ||
| Premium | Premium | Premium | ||
| $621 | Top 40% |
|
||
| Premium | Premium | Premium |
Housing Supply in Rudds Gully

The higher the supply score the more supply is on the market, both current and future.
Sources: ABS, GEOSPATIAL, Property Listings and Microburbs, 2002 - 2023
Sources: ABS, GEOSPATIAL, Property Listings and Microburbs, 2002 - 2023
Rudds Gully
48.1%
Rudds Gully
48.1%
Regional WA
53.5%
Regional WA
53.5%
| Field | Value | VS Regional WA | Trend | |
|---|---|---|---|---|
| 0 | Bottom 38% | Data for Jun 2025 | ||
| 2.0 | Bottom 42% | Data for Jul 2023 | ||
| Premium | Premium | Premium | ||
| Premium | Premium | Premium | ||
| Premium | Premium | Premium | ||
| Premium | Premium | Premium | ||
| 1 | Top 44% |
|
Housing Stock Quality in Rudds Gully
The higher the score, the higher the quality of the houses and units.
Sources: ABS, GEOSPATIAL, Property Listings and Microburbs, 2006 - 2023
Sources: ABS, GEOSPATIAL, Property Listings and Microburbs, 2006 - 2023
| Field | Value | VS Regional WA | Trend | |
|---|---|---|---|---|
| 100.0% | Top 31% | Data for Jan 2021 | ||
| 3.2 | Top 6% |
|
||
| 0.0% | Bottom 37% | Data for Jun 2023 |
Development Restrictions in Rudds Gully

The higher the score, the more easily density can be increased.
Sources: GEOSPATIAL, TORREN and Microburbs, 2011 - 2023
Sources: GEOSPATIAL, TORREN and Microburbs, 2011 - 2023
Rudds Gully
23.0%
Rudds Gully
23.0%
Regional WA
28.5%
Regional WA
28.5%
| Field | Value | VS Regional WA | Trend |
|---|
Risk in Rudds Gully

The higher the score, the more exposed households are to financial stress.
Sources: ABS, Property Listings, TORREN and Microburbs, 2006 - 2023
Sources: ABS, Property Listings, TORREN and Microburbs, 2006 - 2023
Rudds Gully
41.0
Rudds Gully
41.0
Regional WA
31.5
Regional WA
31.5
| Field | Value | VS Regional WA | Trend | |
|---|---|---|---|---|
| 96.0% | Top 34% | Data for May 2023 | ||
| 4.0% | Bottom 34% | Data for May 2023 | ||
| 25 | Bottom 22% | Data for Jun 2023 | ||
| $1,970 | Top 47% | 0 to May 2023 | ||
| 82 | Top 25% | Data for Jun 2023 | ||
| 86 | Top 3% | Data for Jun 2023 | ||
| 19.0% | Bottom 33% |
|
||
| 55.8% | Top 12% |
|
Housing Demand in Rudds Gully
The higher the score, the more demand their is for housing in the area, both current and future.
Sources: ABS, TORREN, Property Listings and Microburbs, 2006 - 2030
Sources: ABS, TORREN, Property Listings and Microburbs, 2006 - 2030
Rudds Gully
47.0%
Rudds Gully
47.0%
Regional WA
40.5%
Regional WA
40.5%
| Field | Value | VS Regional WA | Trend | |
|---|---|---|---|---|
| Premium | Premium | Premium | ||
| 8740 | Bottom 35% |
|
||
| 58200 | Bottom 43% |
|
||
| Premium | Premium | Premium | ||
| 40100 | Top 31% |
|
||
| Premium | Premium | Premium | ||
| Premium | Premium | Premium |
Unit Market in Rudds Gully
Sources: Property Listings and Microburbs, 2002 - 2023
| Field | Value | VS Regional WA | Trend | |
|---|---|---|---|---|
| Premium | Premium | Premium | ||
| 71.6% | Bottom 40% |
|
LGA Details (1)
| Headline | Place | Datetime |
|---|---|---|
| Local government area | Greater Geraldton |
Percent of Renters by Street (11)
| Percent of Renters | Street |
|---|---|
| 0.0% | Admiral Link |
| 0.0% | Brand Hwy |
| 0.0% | Era Ln |
| 0.0% | Hampton Rd |
| 0.0% | Jandanol Rd |
Turnover Rate by Street (8)
| Turnover rate | Street | Turnover Label | Turnover Years | Year |
|---|---|---|---|---|
| 45.5% | Jandanol Rd | very tightly held | Every 22.0 years (very tightly held) | 2025 |
| 55.3% | Meadowcroft St | quite tightly held | Every 18.1 years (quite tightly held) | 2025 |
| 129.4% | Readhead St | very high turnover | Every 7.7 years (very high turnover) | 2025 |
| 250.0% | Kangaroo Rdge | very high turnover | Every 4.0 years (very high turnover) | 2025 |
| 100.0% | Scott Rd | high turnover | Every 10.0 years (high turnover) | 2025 |
Recently Sold Houses (47)
| Address | Price | Bedrooms | Bathrooms | Garage spaces | Date sold | Subdivisible into | Sale Type |
|---|---|---|---|---|---|---|---|
| 32 Meadowcroft St | Price Withheld | 4.0 | 2.0 | 2.0 | 20 Jan 2025 | 0 | On Market |
| 32 Meadowcroft St | $710,000 | 4.0 | 2.0 | 2.0 | 20 Jan 2025 | 0 | On Market |
| 3 Meadowcroft St | $670,000 | 3.0 | 1.0 | 0.0 | 10 Dec 2024 | 0 | On Market |
| 13 Admiral Link | Price Withheld | 4.0 | 2.0 | 2.0 | 04 Dec 2024 | 0 | On Market |
| 17 Meadowcroft St | $215,000 | 0.0 | 0.0 | 0.0 | 07 Sep 2024 | 0 | On Market |
Median House Sale Prices by Street (81)
| Street | Date | Median sale value |
|---|---|---|
| Kangaroo Rdge | 06 Oct 2023 | $473,000 |
| Jandanol Rd | 06 Oct 2023 | $1,350,000 |
| Meadowcroft St | 06 Oct 2023 | $591,300 |
| Mcconkey Rd | 06 Oct 2023 | $540,000 |
| Readhead St | 06 Oct 2023 | $585,000 |
Recent Rental House Listings (100)
| Address | Rent (per week) | Bedrooms | Bathrooms | Garage spaces | Date | Subdivisible into |
|---|---|---|---|---|---|---|
| 3 Meadowcroft St | $670 | 3 | 1 | 3 | 03 Jan 2025 | 0 |
| 3 Meadowcroft St | $670 | 3 | 1 | 3 | 03 Jan 2025 | 0 |
| 3 Meadowcroft St | $670 | 3 | 1 | 3 | 03 Jan 2025 | 0 |
| 3 Meadowcroft St | $670 | 3 | 1 | 3 | 03 Jan 2025 | 0 |
| 3 Meadowcroft St | $670 | 3 | 1 | 3 | 03 Jan 2025 | 0 |
Recent Rental Unit Listings (21)
| Address | Rent (per week) | Bedrooms | Bathrooms | Garage spaces | Date |
|---|---|---|---|---|---|
| 35 Meadowcroft St | $250 | 2.0 | 1.0 | 02 Jan 2018 | |
| 35 Meadowcroft St | $250 | 2.0 | 1.0 | 02 Jan 2018 | |
| 35 Meadowcroft St | $250 | 2.0 | 1.0 | 02 Jan 2018 | |
| 35 Meadowcroft St | $250 | 2.0 | 1.0 | 02 Jan 2018 | |
| 35 Meadowcroft St | $250 | 2.0 | 1.0 | 02 Jan 2018 |
Recently Sold Units (100)
| Address | Price | Bedrooms | Bathrooms | Garage spaces | Date sold | Sale Type |
|---|---|---|---|---|---|---|
| 17 Meadowcroft St | $215,000 | 0.0 | 0.0 | 0.0 | 07 Sep 2024 | On Market |
| 17 Meadowcroft St | $215,000 | 0.0 | 0.0 | 0.0 | 07 Sep 2024 | On Market |
| 17 Meadowcroft St | $215,000 | 0.0 | 0.0 | 0.0 | 07 Sep 2024 | On Market |
| 17 Meadowcroft St | $215,000 | 0.0 | 0.0 | 0.0 | 07 Sep 2024 | On Market |
| 17 Meadowcroft St | $215,000 | 0.0 | 0.0 | 0.0 | 07 Sep 2024 | On Market |
Loading entities ..