.png)
Profiles
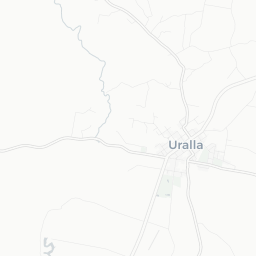
Nearby Suburbs
Real Estate Market: Is Saumarez NSW 2350 a Good Suburb to Buy Into?
Housing Market in Saumarez

Sources: Property Listings, TORREN and Microburbs, 2006 - 2023
| Field | Value | VS New England and North West | Trend | |
|---|---|---|---|---|
| Premium | Premium | Premium | ||
| Premium | Premium | Premium |
Housing Supply in Saumarez

The higher the supply score the more supply is on the market, both current and future.
Sources: ABS, GEOSPATIAL, Property Listings, PLANNING ALERTS and Microburbs, 2002 - 2031
Sources: ABS, GEOSPATIAL, Property Listings, PLANNING ALERTS and Microburbs, 2002 - 2031
Saumarez
46.7%
Saumarez
46.7%
New England and North West
40.2%
New England and North West
40.2%
| Field | Value | VS New England and North West | Trend | |
|---|---|---|---|---|
| 0 | Bottom 38% | Data for Jun 2025 | ||
| 10.2 | Top 15% | Data for Jul 2023 | ||
| Premium | Premium | Premium | ||
| Premium | Premium | Premium | ||
| Premium | Premium | Premium | ||
| Premium | Premium | Premium | ||
| 0 | Bottom 25% | Data for Apr 2025 |
Housing Stock Quality in Saumarez
The higher the score, the higher the quality of the houses and units.
Sources: ABS, GEOSPATIAL and Microburbs, 2006 - 2023
Sources: ABS, GEOSPATIAL and Microburbs, 2006 - 2023
| Field | Value | VS New England and North West | Trend | |
|---|---|---|---|---|
| 100.0% | Top 31% | Data for Jan 2021 | ||
| 2.2 | Bottom 26% |
|
||
| 0.0% | Bottom 37% | Data for Jun 2023 |
Development Restrictions in Saumarez

The higher the score, the more easily density can be increased.
Sources: GEOSPATIAL, TORREN and Microburbs, 2011 - 2023
Sources: GEOSPATIAL, TORREN and Microburbs, 2011 - 2023
Saumarez
20.0%
Saumarez
20.0%
New England and North West
28.8%
New England and North West
28.8%
| Field | Value | VS New England and North West | Trend | |
|---|---|---|---|---|
| 0.0% | Bottom 31% | Data for Jun 2023 | ||
| 0 | Bottom 16% | Data for Jun 2023 |
Risk in Saumarez

The higher the score, the more exposed households are to financial stress.
Sources: ABS, Property Listings, TORREN and Microburbs, 2006 - 2023
Sources: ABS, Property Listings, TORREN and Microburbs, 2006 - 2023
Saumarez
34.0
Saumarez
34.0
New England and North West
38.6
New England and North West
38.6
| Field | Value | VS New England and North West | Trend | |
|---|---|---|---|---|
| 100.0% | Top 11% | Data for May 2023 | ||
| 0.0% | Bottom 11% | Data for May 2023 | ||
| 35 | Top 41% | Data for Jun 2023 | ||
| $2,880 | Top 13% |
|
||
| 79 | Top 49% | Data for Jun 2023 | ||
| 76 | Bottom 49% | Data for Jun 2023 | ||
| 28.5% | Top 20% |
|
||
| 32.3% | Bottom 32% |
|
Housing Demand in Saumarez
The higher the score, the more demand their is for housing in the area, both current and future.
Sources: ABS, TORREN, Property Listings and Microburbs, 2006 - 2030
Sources: ABS, TORREN, Property Listings and Microburbs, 2006 - 2030
Saumarez
30.0%
Saumarez
30.0%
New England and North West
48.0%
New England and North West
48.0%
| Field | Value | VS New England and North West | Trend | |
|---|---|---|---|---|
| Premium | Premium | Premium | ||
| 4740 | Bottom 16% |
|
||
| 38000 | Bottom 21% |
|
||
| Premium | Premium | Premium | ||
| 6010 | Bottom 35% |
|
||
| Premium | Premium | Premium | ||
| Premium | Premium | Premium |
Turnover Rate by Street (6)
| Turnover rate | Street | Turnover Label | Turnover Years | Year |
|---|---|---|---|---|
| 50.0% | Arding Rd | very tightly held | Every 20.0 years (very tightly held) | 2025 |
| 50.0% | New England Hwy | very tightly held | Every 20.0 years (very tightly held) | 2025 |
| 33.3% | Saumarez War Service Rd | very tightly held | Every 30.0 years (very tightly held) | 2025 |
| 53.8% | Wattle Dr | quite tightly held | Every 18.6 years (quite tightly held) | 2025 |
| 50.0% | Pine Ave | very tightly held | Every 20.0 years (very tightly held) | 2025 |
Percent of Renters by Street (7)
| Percent of Renters | Street |
|---|---|
| 0.0% | Arding Rd |
| 55.6% | Pine Ave |
| 0.0% | Wattle Dr |
| 0.0% | New England Hwy |
| 100.0% | Rosetta Ct |
LGA Details (1)
| Headline | Place | Datetime |
|---|---|---|
| Local government area | Uralla |
Recently Sold Houses (15)
| Address | Price | Bedrooms | Bathrooms | Garage spaces | Date sold | Subdivisible into | Sale Type |
|---|---|---|---|---|---|---|---|
| 9964 New England Hwy | $920,000 | 6.0 | 3.0 | 17.0 | 21 Feb 2025 | 0 | On Market |
| 9964 New England Hwy | $920,000 | 21 Feb 2025 | 0 | On Market | |||
| 67 Wattle Dr | $1,150,000 | 5.0 | 6.0 | 8.0 | 13 Aug 2024 | 0 | On Market |
| 44 Tuberosa Rd | $750,000 | 4.0 | 2.0 | 2.0 | 03 May 2024 | 0 | On Market |
| 19 Tuberosa Rd | Price Withheld | 16 Jan 2023 | 0 | On Market |
Planning Applications: Dwellings (1)
| Headline | Place | Date |
|---|---|---|
| Change of Use - Dual Occupancy - Conversion of Shed to Dwelling - Uralla Shire Council DA2019/49.1 | 41 Saumarez War Service Road Saumarez 2350 NSW | 04 Jul 2019 |
Businesses (3)
| Name | Address |
|---|---|
| Christensen Peder | 63 Wattle Dr, Saumarez NSW 2350, Australia |
| Christensen Peder | 63, Wattle Dr |
| Christensen Peder | 63, Wattle Dr |
Median House Sale Prices by Street (46)
| Street | Date | Median sale value |
|---|---|---|
| Wattle Dr | 06 Oct 2023 | $670,000 |
| Tuberosa Rd | 06 Oct 2023 | $670,000 |
| Saumarez War Service Rd | 06 Oct 2023 | $4,661,000 |
| Pine Ave | 06 Oct 2023 | $612,000 |
| Arding Rd | 06 Oct 2023 | $670,000 |
Recent Rental House Listings (100)
| Address | Rent (per week) | Bedrooms | Bathrooms | Garage spaces | Date | Subdivisible into |
|---|---|---|---|---|---|---|
| 16 Rosetta Ct | Price Withheld | 5 | 3 | 4 | 14 Feb 2022 | 0 |
| 16 Rosetta Ct | Price Withheld | 5 | 3 | 4 | 14 Feb 2022 | 0 |
| 16 Rosetta Ct | Price Withheld | 5 | 3 | 4 | 14 Feb 2022 | 0 |
| 16 Rosetta Ct | Price Withheld | 5 | 3 | 4 | 14 Feb 2022 | 0 |
| 16 Rosetta Ct | Price Withheld | 5 | 3 | 4 | 14 Feb 2022 | 0 |
Recent Rental Unit Listings (100)
| Address | Rent (per week) | Bedrooms | Bathrooms | Garage spaces | Date |
|---|---|---|---|---|---|
| 28 Pine Ave | Price Withheld | 3.0 | 1.0 | 3.0 | 09 Feb 2023 |
| 28 Pine Ave | Price Withheld | 3.0 | 1.0 | 3.0 | 09 Feb 2023 |
| 28 Pine Ave | Price Withheld | 3.0 | 1.0 | 3.0 | 09 Feb 2023 |
| 28 Pine Ave | Price Withheld | 3.0 | 1.0 | 3.0 | 09 Feb 2023 |
| 28 Pine Ave | Price Withheld | 3.0 | 1.0 | 3.0 | 09 Feb 2023 |
Recently Sold Units (100)
| Address | Price | Bedrooms | Bathrooms | Garage spaces | Date sold | Sale Type |
|---|---|---|---|---|---|---|
| 67 Wattle Dr | $1,150,000 | 5.0 | 6.0 | 8.0 | 13 Aug 2024 | On Market |
| 67 Wattle Dr | $1,150,000 | 5.0 | 6.0 | 8.0 | 13 Aug 2024 | On Market |
| 67 Wattle Dr | $1,150,000 | 5.0 | 6.0 | 8.0 | 13 Aug 2024 | On Market |
| 67 Wattle Dr | $1,150,000 | 5.0 | 6.0 | 8.0 | 13 Aug 2024 | On Market |
| 67 Wattle Dr | $1,150,000 | 5.0 | 6.0 | 8.0 | 13 Aug 2024 | On Market |
Loading entities ..