.png)
Profiles
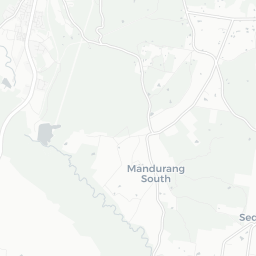
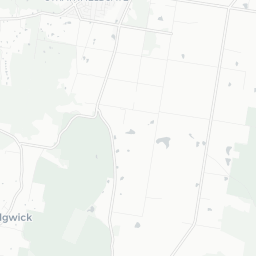
Nearby Suburbs
Real Estate Market: Is Sedgwick VIC 3551 a Good Suburb to Buy Into?
Housing Market in Sedgwick

Sources: Property Listings and Microburbs, 2002 - 2023
| Field | Value | VS Bendigo | Trend | |
|---|---|---|---|---|
| Premium | Premium | Premium | ||
| Premium | Premium | Premium | ||
| Premium | Premium | Premium | ||
| $529 | Bottom 31% |
|
||
| Premium | Premium | Premium |
Housing Supply in Sedgwick

The higher the supply score the more supply is on the market, both current and future.
Sources: ABS, GEOSPATIAL, Property Listings, PLANNING ALERTS and Microburbs, 2002 - 2023
Sources: ABS, GEOSPATIAL, Property Listings, PLANNING ALERTS and Microburbs, 2002 - 2023
Sedgwick
31.6%
Sedgwick
31.6%
Bendigo
33.0%
Bendigo
33.0%
| Field | Value | VS Bendigo | Trend | |
|---|---|---|---|---|
| 0 | Bottom 38% | Data for Jun 2025 | ||
| 0.6 | Bottom 30% | Data for Jul 2023 | ||
| Premium | Premium | Premium | ||
| Premium | Premium | Premium | ||
| Premium | Premium | Premium | ||
| 30 lots | Top 13% |
|
||
| Premium | Premium | Premium | ||
| Premium | Premium | Premium | ||
| 0 | Bottom 25% | Data for Apr 2025 |
Housing Stock Quality in Sedgwick
The higher the score, the higher the quality of the houses and units.
Sources: ABS, GEOSPATIAL, Property Listings and Microburbs, 2006 - 2023
Sources: ABS, GEOSPATIAL, Property Listings and Microburbs, 2006 - 2023
| Field | Value | VS Bendigo | Trend | |
|---|---|---|---|---|
| 100.0% | Top 31% | Data for Jan 2021 | ||
| 2.8 | Top 23% |
|
||
| 0.0% | Bottom 37% | Data for Jun 2023 |
Development Restrictions in Sedgwick

The higher the score, the more easily density can be increased.
Sources: GEOSPATIAL, TORREN and Microburbs, 2011 - 2023
Sources: GEOSPATIAL, TORREN and Microburbs, 2011 - 2023
Sedgwick
19.2%
Sedgwick
19.2%
Bendigo
27.6%
Bendigo
27.6%
| Field | Value | VS Bendigo | Trend | |
|---|---|---|---|---|
| 0.1 sq km | Top 30% | Data for Jun 2023 |
Risk in Sedgwick

The higher the score, the more exposed households are to financial stress.
Sources: ABS, Property Listings, TORREN and Microburbs, 2006 - 2023
Sources: ABS, Property Listings, TORREN and Microburbs, 2006 - 2023
Sedgwick
39.8
Sedgwick
39.8
Bendigo
38.2
Bendigo
38.2
| Field | Value | VS Bendigo | Trend | |
|---|---|---|---|---|
| 100.0% | Top 11% | Data for May 2023 | ||
| 0.0% | Bottom 11% | Data for May 2023 | ||
| 34 | Top 46% | Data for Jun 2023 | ||
| $2,720 | Top 16% |
|
||
| 82 | Top 29% | Data for Jun 2023 | ||
| 80 | Top 23% | Data for Jun 2023 | ||
| 20.8% | Bottom 42% |
|
||
| 53.8% | Top 15% |
|
Housing Demand in Sedgwick
The higher the score, the more demand their is for housing in the area, both current and future.
Sources: ABS, TORREN, Property Listings and Microburbs, 2006 - 2030
Sources: ABS, TORREN, Property Listings and Microburbs, 2006 - 2030
Sedgwick
55.8%
Sedgwick
55.8%
Bendigo
62.7%
Bendigo
62.7%
| Field | Value | VS Bendigo | Trend | |
|---|---|---|---|---|
| Premium | Premium | Premium | ||
| Premium | Premium | Premium | ||
| 11200 | Bottom 44% |
|
||
| 53600 | Bottom 38% |
|
||
| Premium | Premium | Premium | ||
| 135000 | Top 13% |
|
||
| Premium | Premium | Premium | ||
| Premium | Premium | Premium | ||
| Premium | Premium | Premium |
Unit Market in Sedgwick
Sources: Property Listings and Microburbs, 2002 - 2023
| Field | Value | VS Bendigo | Trend | |
|---|---|---|---|---|
| Premium | Premium | Premium | ||
| $382 | Bottom 12% |
|
||
| Premium | Premium | Premium | ||
| 65.7% | Bottom 31% |
|
LGA Details (1)
| Headline | Place | Datetime |
|---|---|---|
| Local government area | Greater Bendigo |
Percent of Renters by Street (31)
| Percent of Renters | Street |
|---|---|
| 0.0% | Axe Creek Rd |
| 14.8% | Cavagna Rd |
| 0.0% | Brock Rd |
| 0.0% | Blossett Dr |
| 0.0% | Boyd Ln |
Turnover Rate by Street (23)
| Turnover rate | Street | Turnover Label | Turnover Years | Year |
|---|---|---|---|---|
| 102.7% | Sedgwick Rd | high turnover | Every 9.7 years (high turnover) | 2025 |
| 87.5% | Heritage Dr | high turnover | Every 11.4 years (high turnover) | 2025 |
| 100.0% | Claremont Pl | high turnover | Every 10.0 years (high turnover) | 2025 |
| 200.0% | Roseneath Ln | very high turnover | Every 5.0 years (very high turnover) | 2025 |
| 106.7% | Axe Creek Rd | very high turnover | Every 9.4 years (very high turnover) | 2025 |
Planning Applications: Dwellings (3)
| Headline | Place | Date |
|---|---|---|
| Development of dwelling and convert existing dwelling into a non-habitable building (games room) - City of Greater Bendigo DR/37/2025 | 63 Glen Clare Drive, Sedgwick 3551, VIC | 27 Feb 2025 |
| To subdivide the property into two lots and retain the existing dwelling on proposed lot 2. - Streamlined Planning through Electronic Applications and Referrals S216024C | 81 Youngs Lane, Sedgwick VIC 3551 | 20 Jul 2023 |
| Use and development of land for a dwelling and associated earthworks - City of Greater Bendigo DR/717/2021 | 98 Youngs Lane, Sedgwick 3551, VIC | 09 Nov 2022 |
Planning Applications: Other (3)
| Headline | Place | Date |
|---|---|---|
| To remove easement E-2 from PS611393V. - Streamlined Planning through Electronic Applications and Referrals S197386V | 332 Sedgwick Road, Sedgwick VIC 3551 | 06 Jul 2022 |
| Certification of a Plan - Streamlined Planning through Electronic Applications and Referrals S159685E | 259 Sutton Grange Road, Sedgwick VIC 3551 | 15 Jun 2020 |
| Certification of a Plan - Streamlined Planning through Electronic Applications and Referrals S159073B | 23 Wilkinsons Road, Sedgwick VIC 3551 | 02 Jun 2020 |
Recently Sold Houses (100)
| Address | Price | Bedrooms | Bathrooms | Garage spaces | Date sold | Subdivisible into | Sale Type |
|---|---|---|---|---|---|---|---|
| 146 Sutton Grange Rd | $590,500 | 0.0 | 0.0 | 0.0 | 09 Jan 2025 | 0 | On Market |
| 2 Roseneath Ln | $935,000 | 4.0 | 3.0 | 4.0 | 29 Oct 2024 | 0 | On Market |
| 2 Roseneath Ln | Price Withheld | 4.0 | 3.0 | 4.0 | 29 Oct 2024 | 0 | On Market |
| 2 Roseneath Ln | Price Withheld | 4.0 | 3.0 | 4.0 | 12 Aug 2024 | 0 | On Market |
| 403 Sedgwick Rd | Price Withheld | 2.0 | 1.0 | 2.0 | 10 Jul 2024 | 0 | On Market |
Median House Sale Prices by Street (100)
| Street | Date | Median sale value |
|---|---|---|
| Roseneath Ln | 10 May 2024 | $1,412,000 |
| Youngs Ln | 10 May 2024 | $1,200,000 |
| Sedgwick Rd | 10 May 2024 | $1,300,000 |
| Heritage Dr | 10 May 2024 | $1,263,000 |
| North Harcourt Rd | 06 Oct 2023 | $900,000 |
Recent Rental House Listings (100)
| Address | Rent (per week) | Bedrooms | Bathrooms | Garage spaces | Date | Subdivisible into |
|---|---|---|---|---|---|---|
| 749 North Harcourt Rd | $460 | 3 | 1 | 2 | 04 Oct 2024 | 0 |
| 749 North Harcourt Rd | $460 | 3 | 1 | 2 | 04 Oct 2024 | 0 |
| 749 North Harcourt Rd | $460 | 3 | 1 | 2 | 04 Oct 2024 | 0 |
| 749 North Harcourt Rd | $460 | 3 | 1 | 2 | 04 Oct 2024 | 0 |
| 749 North Harcourt Rd | $460 | 3 | 1 | 2 | 04 Oct 2024 | 0 |
Recent Rental Unit Listings (100)
| Address | Rent (per week) | Bedrooms | Bathrooms | Garage spaces | Date |
|---|---|---|---|---|---|
| 749 North Harcourt Rd | $460 | 3.0 | 1.0 | 2.0 | 04 Oct 2024 |
| 749 North Harcourt Rd | $460 | 3.0 | 1.0 | 2.0 | 04 Oct 2024 |
| 749 North Harcourt Rd | $460 | 3.0 | 1.0 | 2.0 | 04 Oct 2024 |
| 749 North Harcourt Rd | $460 | 3.0 | 1.0 | 2.0 | 04 Oct 2024 |
| 749 North Harcourt Rd | $460 | 3.0 | 1.0 | 2.0 | 04 Oct 2024 |
Recently Sold Units (100)
| Address | Price | Bedrooms | Bathrooms | Garage spaces | Date sold | Sale Type |
|---|---|---|---|---|---|---|
| 146 Sutton Grange Rd | Price Withheld | 0.0 | 0.0 | 0.0 | 09 Jan 2025 | On Market |
| 146 Sutton Grange Rd | Price Withheld | 0.0 | 0.0 | 0.0 | 09 Jan 2025 | On Market |
| 146 Sutton Grange Rd | Price Withheld | 0.0 | 0.0 | 0.0 | 09 Jan 2025 | On Market |
| 146 Sutton Grange Rd | Price Withheld | 0.0 | 0.0 | 0.0 | 09 Jan 2025 | On Market |
| 146 Sutton Grange Rd | Price Withheld | 0.0 | 0.0 | 0.0 | 09 Jan 2025 | On Market |
Loading entities ..