.png)
Profiles
Nearby Suburbs
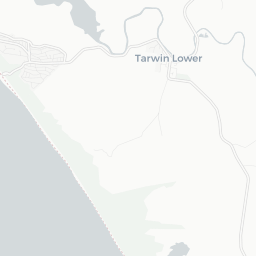
Real Estate Market: Is Tarwin Lower VIC 3956 a Good Suburb to Buy Into?
Housing Market in Tarwin Lower

Sources: Property Listings and Microburbs, 2002 - 2023
| Field | Value | VS Latrobe | Trend | |
|---|---|---|---|---|
| Premium | Premium | Premium | ||
| Premium | Premium | Premium | ||
| Premium | Premium | Premium | ||
| $456 | Bottom 8% |
|
||
| Premium | Premium | Premium |
Housing Supply in Tarwin Lower

The higher the supply score the more supply is on the market, both current and future.
Sources: ABS, GEOSPATIAL, Property Listings, PLANNING ALERTS and Microburbs, 2002 - 2023
Sources: ABS, GEOSPATIAL, Property Listings, PLANNING ALERTS and Microburbs, 2002 - 2023
Tarwin Lower
46.5%
Tarwin Lower
46.5%
Latrobe
33.6%
Latrobe
33.6%
| Field | Value | VS Latrobe | Trend | |
|---|---|---|---|---|
| 0 | Bottom 38% |
|
||
| 0.0 | Bottom 10% | Data for Jul 2023 | ||
| 38.0 | Top 18% | Data for May 2023 | ||
| Premium | Premium | Premium | ||
| Premium | Premium | Premium | ||
| Premium | Premium | Premium | ||
| Premium | Premium | Premium | ||
| Premium | Premium | Premium | ||
| 6 | Top 21% |
|
Housing Stock Quality in Tarwin Lower
The higher the score, the higher the quality of the houses and units.
Sources: ABS, GEOSPATIAL, Property Listings and Microburbs, 2006 - 2023
Sources: ABS, GEOSPATIAL, Property Listings and Microburbs, 2006 - 2023
| Field | Value | VS Latrobe | Trend | |
|---|---|---|---|---|
| 97.4% | Bottom 32% |
|
||
| 2.2 | Bottom 26% |
|
||
| 0.0% | Top 25% | Data for Jun 2023 |
Development Restrictions in Tarwin Lower

The higher the score, the more easily density can be increased.
Sources: GEOSPATIAL, TORREN, ABS and Microburbs, 2011 - 2023
Sources: GEOSPATIAL, TORREN, ABS and Microburbs, 2011 - 2023
Tarwin Lower
22.2%
Tarwin Lower
22.2%
Latrobe
30.6%
Latrobe
30.6%
| Field | Value | VS Latrobe | Trend | |
|---|---|---|---|---|
| 120.0 sq km | Top 9% | Data for Jan 2021 | ||
| 0.1 sq km | Top 40% | Data for Jun 2023 | ||
| 1090 sqm per resident | Bottom 46% | Data for Jan 2021 |
Risk in Tarwin Lower

The higher the score, the more exposed households are to financial stress.
Sources: ABS, Property Listings, TORREN and Microburbs, 2006 - 2023
Sources: ABS, Property Listings, TORREN and Microburbs, 2006 - 2023
Tarwin Lower
34.3
Tarwin Lower
34.3
Latrobe
36.1
Latrobe
36.1
| Field | Value | VS Latrobe | Trend | |
|---|---|---|---|---|
| 86.6% | Bottom 31% |
|
||
| 13.4% | Top 31% |
|
||
| 34 | Top 45% | Data for Jun 2023 | ||
| $1,170 | Bottom 14% |
|
||
| 80 | Top 42% | Data for Jun 2023 | ||
| 71 | Bottom 25% | Data for Jun 2023 | ||
| 28.2% | Top 21% |
|
||
| 36.8% | Bottom 45% |
|
Housing Demand in Tarwin Lower
The higher the score, the more demand their is for housing in the area, both current and future.
Sources: ABS, TORREN, Property Listings and Microburbs, 2006 - 2030
Sources: ABS, TORREN, Property Listings and Microburbs, 2006 - 2030
Tarwin Lower
41.1%
Tarwin Lower
41.1%
Latrobe
55.8%
Latrobe
55.8%
| Field | Value | VS Latrobe | Trend | |
|---|---|---|---|---|
| Premium | Premium | Premium | ||
| Premium | Premium | Premium | ||
| 10800 | Bottom 42% |
|
||
| 73700 | Top 42% |
|
||
| Premium | Premium | Premium | ||
| 31600 | Top 35% |
|
||
| Premium | Premium | Premium | ||
| Premium | Premium | Premium | ||
| Premium | Premium | Premium |
Unit Market in Tarwin Lower
Sources: Property Listings and Microburbs, 2002 - 2023
| Field | Value | VS Latrobe | Trend | |
|---|---|---|---|---|
| Premium | Premium | Premium | ||
| $423 | Bottom 29% |
|
||
| Premium | Premium | Premium | ||
| 87.3% | Top 21% |
|
LGA Details (1)
| Headline | Place | Datetime |
|---|---|---|
| Local government area | South Gippsland |
Accommodation Options (3)
| Headline | Place | Datetime |
|---|---|---|
| Tarwin River Motel | 19-21 River Dr | |
Percent of Renters by Street (37)
| Percent of Renters | Street |
|---|---|
| 20.0% | Arbuthnots Rd |
| 0.0% | Bear Gully Rd |
| 0.0% | Arnott St |
| 0.0% | Bald Hills Rd |
| 0.0% | Burrows None |
Turnover Rate by Street (33)
| Turnover rate | Street | Turnover Label | Turnover Years | Year |
|---|---|---|---|---|
| 87.3% | Walkerville Rd | average turnover | Every 11.5 years (average turnover) | 2025 |
| 100.0% | Munbilla Rd | high turnover | Every 10.0 years (high turnover) | 2025 |
| 75.0% | Ripple Landing | average turnover | Every 13.3 years (average turnover) | 2025 |
| 20.0% | Tarwin Meadows Rd | very tightly held | Every 50.0 years (very tightly held) | 2025 |
| 80.0% | Bear Gully Rd | average turnover | Every 12.5 years (average turnover) | 2025 |
Planning Applications: Other (4)
| Headline | Place | Date |
|---|---|---|
| Limited Licence - Renewable - Victorian Gambling and Casino Control Commission 71799A01 | 19-21 River Dr, Tarwin Lower 3956, VIC | 22 Aug 2022 |
| App.Online - Transfer of licence to Company - Victorian Commission for Gambling and Liquor Regulation 13793A19 | 11-15 River Drive, Tarwin Lower 3956, VIC | 09 Nov 2020 |
| Renewal of licence by Owner etc - to nominate licensee - Victorian Commission for Gambling and Liquor Regulation 59199A06 | 41-43 River Drive, Tarwin Lower 3956, VIC | 01 Sep 2020 |
| Certification of a Plan - Streamlined Planning through Electronic Applications and Referrals S160017M | 368 Walkerville South Road, Tarwin Lower VIC 3956 | 22 Jun 2020 |
Planning Applications: Dwellings (2)
| Headline | Place | Date |
|---|---|---|
| Develop land with a building (stockyard cover) associated with agriculture - South Gippsland Shire Council 2021/403 | 368 Walkerville South Road Tarwin Lower VIC 3956 | 08 Dec 2021 |
| Develop land with an extension to existing dwelling - South Gippsland Shire Council 2020/265 | 12 Tarwin Place Tarwin Lower VIC 3956 | 19 Aug 2020 |
Businesses (13)
| Name | Address |
|---|---|
| Darren Harris Excavations & Cartage | 140 Masons Rd, Tarwin Lower VIC 3956, Australia |
| Taylors Plumbing Pty Ltd | 1760 Walkerville Rd, Tarwin Lower VIC 3956, Australia |
| Capeview Mitre 10 Tarwin Lower | 31-33 River Dr, Tarwin Lower VIC 3956, Australia |
| Darren Harris Excavations & Cartage | |
| Tarwin River Motel | 19-21 River Dr |
Median Unit Sale Prices by Street (2)
| Date | Median sale value | Street |
|---|---|---|
| 06 Oct 2023 | $2,020,000 | Inverloch-Venus Bay Rd |
| 06 Oct 2023 | $1,435,000 | Powneys Rd |
Recently Sold Houses (100)
| Address | Price | Bedrooms | Bathrooms | Garage spaces | Date sold | Subdivisible into | Sale Type |
|---|---|---|---|---|---|---|---|
| 1 River Dr | Price Withheld | 3.0 | 1.0 | 0.0 | 16 Dec 2024 | 0 | On Market |
| 1 River Dr | $420,000 | 3.0 | 1.0 | 0.0 | 16 Dec 2024 | 0 | On Market |
| 40 Arbuthnots Rd | $1,070,000 | 4.0 | 2.0 | 16 Dec 2024 | 0 | On Market | |
| 28 Ripple Landing | $410,000 | 0.0 | 0.0 | 0.0 | 03 Sep 2024 | 0 | On Market |
| 85 Powneys Rd | $1,230,000 | 4.0 | 2.0 | 2.0 | 26 Mar 2024 | 0 | On Market |
Median House Sale Prices by Street (100)
| Street | Date | Median sale value |
|---|---|---|
| Fauna Park Rd | 10 May 2024 | $529,500 |
| Ellen Ave | 10 May 2024 | $250,000 |
| Inverloch-Venus Bay Rd | 10 May 2024 | $1,032,000 |
| Walkerville Rd | 10 May 2024 | $399,500 |
| River Dr | 10 May 2024 | $737,500 |
Recent Rental House Listings (100)
| Address | Rent (per week) | Bedrooms | Bathrooms | Garage spaces | Date | Subdivisible into |
|---|---|---|---|---|---|---|
| 220 Tarwin Meadows Rd | $420 | 3 | 1 | 0 | 25 Oct 2024 | 0 |
| 220 Tarwin Meadows Rd | $420 | 3 | 1 | 0 | 25 Oct 2024 | 0 |
| 220 Tarwin Meadows Rd | $420 | 3 | 1 | 0 | 25 Oct 2024 | 0 |
| 220 Tarwin Meadows Rd | $420 | 3 | 1 | 0 | 25 Oct 2024 | 0 |
| 220 Tarwin Meadows Rd | $420 | 3 | 1 | 0 | 25 Oct 2024 | 0 |
Recently Sold Units (100)
| Address | Price | Bedrooms | Bathrooms | Garage spaces | Date sold | Sale Type |
|---|---|---|---|---|---|---|
| 1203 Inverloch-venus Bay Rd | Price Withheld | 3.0 | 1.0 | 4.0 | 17 Sep 2024 | On Market |
| 1203 Inverloch-venus Bay Rd | $2,210,000 | 3.0 | 1.0 | 4.0 | 17 Sep 2024 | On Market |
| 1203 Inverloch-venus Bay Rd | $2,210,000 | 3.0 | 1.0 | 4.0 | 17 Sep 2024 | On Market |
| 1203 Inverloch-venus Bay Rd | $2,210,000 | 3.0 | 1.0 | 4.0 | 17 Sep 2024 | On Market |
| 1203 Inverloch-venus Bay Rd | $2,210,000 | 3.0 | 1.0 | 4.0 | 17 Sep 2024 | On Market |
Loading entities ..