Copyright Microburbs Pty Ltd 2014-
2025
.
Contact us
for licensing
Close
GET REPORT
New
Explorer
Profile Page
Logout
Sign Up
Login
Blog
Products
Subscriptions
Suburb Finder
Suburb Reports
Suburb DataExplorer
Free Data Consultation
API Access
Consulting Services
AI Property Finder
Coming Soon
Suburb Finder
2025 Suburb Reports
AI Property Finder
Profiles
People & Lifestyle
Crime & Disadvantage
Real Estate
Affluence & Economy
Environment
Nearby Suburbs
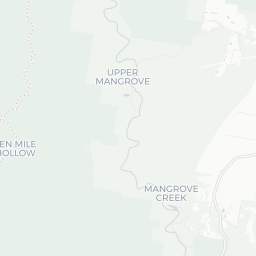
Upper Mangrove
Mangrove Creek
Gunderman
Mangrove Mountain
Lower Mangrove
Kulnura
Greengrove
Spencer
Glenworth Valley
Wisemans Ferry
Real Estate Market: Is Ten Mile Hollow NSW 2250 a Good Suburb to Buy Into?
Housing Market in Ten Mile Hollow
Key Ten Mile Hollow Metrics & Forecast to 2028
Sample Graphic
Sources: Property Listings and Microburbs, 2006 - 2023
Field
Value
VS Central Coast NSW
Trend
Capital Growth Forecast: Houses
Premium
Premium
Premium
Capital Growth Forecast: Houses (2-Year Outlook)
Premium
Premium
Premium
Housing Supply in Ten Mile Hollow
Ten Mile Hollow Real Estate Investor Report
Sample Graphic
The higher the supply score the more supply is on the market, both current and future.
Sources: ABS, GEOSPATIAL, Property Listings and Microburbs, 2002 - 2023
Ten Mile Hollow
65.2%
Ten Mile Hollow
65.2%
Central Coast NSW
34.1%
Central Coast NSW
34.1%
Compare
Suburbs
Field
Value
VS Central Coast NSW
Trend
Developments
33.2
Top 6%
Data for Jul 2023
Housing Stock Quality Indicator
Total new residential buildings value (SA2)
Premium
Premium
Premium
Proportion of subdividable properties
Premium
Premium
Premium
Housing Stock Quality in Ten Mile Hollow
The higher the score, the higher the quality of the houses and units.
Sources: ABS, GEOSPATIAL and Microburbs, 2006 - 2023
Field
Value
VS Central Coast NSW
Trend
Average bedrooms - all homes
0.0
Bottom 2%
Data for Jan 2021
NBN connection: fibreoptic cable to node
0.0%
Bottom 37%
Data for Jun 2023
Development Restrictions in Ten Mile Hollow
Ten Mile Hollow Zoning Map
Sample Graphic
The higher the score, the more easily density can be increased.
Sources: GEOSPATIAL and Microburbs, 2011 - 2023
Ten Mile Hollow
25.8%
Ten Mile Hollow
25.8%
Central Coast NSW
39.4%
Central Coast NSW
39.4%
Compare
Suburbs
Field
Value
VS Central Coast NSW
Trend
Environmental conservation area proportion
0.0%
Bottom 31%
Data for Jun 2023
Heritage sites
3
Top 36%
Data for Jun 2023
Risk in Ten Mile Hollow
Ten Mile Hollow Risk Report
Sample Graphic
The higher the score, the more exposed households are to financial stress.
Sources: ABS, Property Listings and Microburbs, 2006 - 2023
Ten Mile Hollow
60.8%
Ten Mile Hollow
60.8%
Central Coast NSW
63.0%
Central Coast NSW
63.0%
Compare
Suburbs
Field
Value
VS Central Coast NSW
Trend
Housing Affordability Index
48
Top 15%
Data for Jun 2023
Rent Affordability Index (Houses)
75
Bottom 31%
Data for Jun 2023
Rent Affordability Index (Units)
72
Bottom 27%
Data for Jun 2023
Housing Demand in Ten Mile Hollow
The higher the score, the more demand their is for housing in the area, both current and future.
Sources: ABS, TORREN and Microburbs, 2006 - 2030
Ten Mile Hollow
85.5%
Ten Mile Hollow
85.5%
Central Coast NSW
83.0%
Central Coast NSW
83.0%
Compare
Suburbs
Field
Value
VS Central Coast NSW
Trend
Future Population (SA2)
5870
Bottom 21%
22% to Dec 2041
Historical Population (SA3)
180000
Top 5%
11% to Dec 2023
Population (LGA)
352000
Top 1%
19% to Dec 2023
LGA Details (1)
Headline
Place
Datetime
Local government area
Central Coast (NSW)
Loading entities ..
+
−
Leaflet
Subscribe
to see the map content. See samples:
Surry Hills (NSW)
St Kilda (Vic.)
Fortitude Valley
Kent Town
Northbridge (WA)
Darwin City
Glenorchy (Tas.)
Expand ↗️
Loading choropleth for Capital Growth Forecast: Houses
Min
Max
Subscribe
to see the timeline. See samples:
Surry Hills (NSW)
St Kilda (Vic.)
Fortitude Valley
Kent Town
Northbridge (WA)
Darwin City
Glenorchy (Tas.)
Profiles
People & Lifestyle
Crime & Disadvantage
Real Estate
Affluence & Economy
Environment
Nearby Suburbs
Upper Mangrove
Mangrove Creek
Gunderman
Mangrove Mountain
Lower Mangrove
Kulnura
Greengrove
Spencer
Glenworth Valley
Wisemans Ferry
.png)