.png)
Profiles
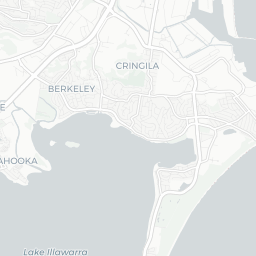
Nearby Suburbs
Real Estate Market: Is Wongawilli NSW 2530 a Good Suburb to Buy Into?
Housing Market in Wongawilli

Sources: Property Listings, TORREN and Microburbs, 2002 - 2023
| Field | Value | VS Illawarra | Trend | |
|---|---|---|---|---|
| Premium | Premium | Premium | ||
| Premium | Premium | Premium | ||
| Premium | Premium | Premium | ||
| $710 | Top 21% |
|
||
| Premium | Premium | Premium |
Housing Supply in Wongawilli

The higher the supply score the more supply is on the market, both current and future.
Sources: ABS, GEOSPATIAL, Property Listings, PLANNING ALERTS, BASIX and Microburbs, 2002 - 2031
Sources: ABS, GEOSPATIAL, Property Listings, PLANNING ALERTS, BASIX and Microburbs, 2002 - 2031
Wongawilli
46.9%
Wongawilli
46.9%
Illawarra
36.5%
Illawarra
36.5%
| Field | Value | VS Illawarra | Trend | |
|---|---|---|---|---|
| 675 | Top 7% |
|
||
| 2.6 | Top 44% | Data for Jul 2023 | ||
| 74.9 | Top 7% | Data for May 2023 | ||
| Premium | Premium | Premium | ||
| Premium | Premium | Premium | ||
| Premium | Premium | Premium | ||
| 220 | Top 1% |
|
||
| 8 lots | Top 45% |
|
||
| Premium | Premium | Premium | ||
| Premium | Premium | Premium | ||
| Premium | Premium | Premium | ||
| 1 | Top 44% |
|
Housing Stock Quality in Wongawilli
The higher the score, the higher the quality of the houses and units.
Sources: ABS, GEOSPATIAL, Property Listings, BASIX and Microburbs, 2006 - 2023
Sources: ABS, GEOSPATIAL, Property Listings, BASIX and Microburbs, 2006 - 2023
| Field | Value | VS Illawarra | Trend | |
|---|---|---|---|---|
| 99.2% | Bottom 36% |
|
||
| 3.4 | Top 3% |
|
||
| 0.0% | Bottom 37% | Data for Jun 2023 | ||
| Premium | Premium | Premium |
Development Restrictions in Wongawilli

The higher the score, the more easily density can be increased.
Sources: GEOSPATIAL, TORREN, ABS and Microburbs, 2011 - 2023
Sources: GEOSPATIAL, TORREN, ABS and Microburbs, 2011 - 2023
Wongawilli
20.5%
Wongawilli
20.5%
Illawarra
20.6%
Illawarra
20.6%
| Field | Value | VS Illawarra | Trend | |
|---|---|---|---|---|
| 2.0 sq km | Bottom 20% | Data for Jan 2021 | ||
| 0.41 | Bottom 6% | Data for Feb 2023 | ||
| 26.3% | Top 4% | Data for Jun 2023 | ||
| 9 | Top 17% | Data for Jun 2023 | ||
| 2100 sqm per resident | Top 40% | Data for Jan 2021 |
Risk in Wongawilli

The higher the score, the more exposed households are to financial stress.
Sources: ABS, Property Listings, TORREN and Microburbs, 2006 - 2023
Sources: ABS, Property Listings, TORREN and Microburbs, 2006 - 2023
Wongawilli
48.3
Wongawilli
48.3
Illawarra
46.7
Illawarra
46.7
| Field | Value | VS Illawarra | Trend | |
|---|---|---|---|---|
| 90.2% | Bottom 43% |
|
||
| 9.8% | Top 43% |
|
||
| 45 | Top 20% | Data for Jun 2023 | ||
| $4,110 | Top 3% |
|
||
| 72 | Bottom 18% | Data for Jun 2023 | ||
| 74 | Bottom 39% | Data for Jun 2023 | ||
| 21.0% | Bottom 43% |
|
||
| 91.6% | Top 1% |
|
Housing Demand in Wongawilli
The higher the score, the more demand their is for housing in the area, both current and future.
Sources: ABS, TORREN, Property Listings and Microburbs, 2006 - 2030
Sources: ABS, TORREN, Property Listings and Microburbs, 2006 - 2030
Wongawilli
78.7%
Wongawilli
78.7%
Illawarra
77.0%
Illawarra
77.0%
| Field | Value | VS Illawarra | Trend | |
|---|---|---|---|---|
| Premium | Premium | Premium | ||
| Premium | Premium | Premium | ||
| 23000 | Top 13% |
|
||
| 81600 | Top 37% |
|
||
| Premium | Premium | Premium | ||
| 244000 | Top 4% |
|
||
| Premium | Premium | Premium | ||
| Premium | Premium | Premium | ||
| Premium | Premium | Premium |
Unit Market in Wongawilli
Sources: Property Listings and Microburbs, 2002 - 2023
| Field | Value | VS Illawarra | Trend | |
|---|---|---|---|---|
| Premium | Premium | Premium | ||
| $452 | Bottom 46% |
|
||
| Premium | Premium | Premium | ||
| 94.6% | Top 19% |
|
Median House Rental Prices by Street (8)
| Street | Date | Median rent (per week) |
|---|---|---|
| Finch St | 06 Mar 2025 | $775 |
| Garreeaira Rd | 06 Mar 2025 | $780 |
| Bankbook Dr | 06 Mar 2025 | $695 |
| Curlew St | 06 Mar 2025 | $750 |
| Schoolyard Pl | 06 Mar 2025 | $690 |
Percent of Renters by Street (31)
| Percent of Renters | Street |
|---|---|
| 19.3% | Finch St |
| 18.4% | Bankbook Dr |
| 7.0% | Coral Vale Dr |
| 0.0% | Garreeaira Rd |
| 24.1% | Curlew St |
LGA Details (1)
| Headline | Place | Datetime |
|---|---|---|
| Local government area | Wollongong |
Turnover Rate by Street (28)
| Turnover rate | Street | Turnover Label | Turnover Years | Year |
|---|---|---|---|---|
| 135.3% | Dairy Farm Way | very high turnover | Every 7.4 years (very high turnover) | 2025 |
| 114.3% | Moorhen St | very high turnover | Every 8.8 years (very high turnover) | 2025 |
| 158.6% | Finch St | very high turnover | Every 6.3 years (very high turnover) | 2025 |
| 127.3% | Styles Ln | very high turnover | Every 7.9 years (very high turnover) | 2025 |
| 164.9% | Bankbook Dr | very high turnover | Every 6.1 years (very high turnover) | 2025 |
Median Unit Sale Prices by Street (1)
| Date | Median sale value | Street |
|---|---|---|
| 06 Oct 2023 | $1,362,000 | Whistler St |
Planning Applications: Dwellings (36)
| Headline | Place | Date |
|---|---|---|
| Residential - Alterations and additions to existing dwelling, associated landscaping and pool - Wollongong City Council DA-2024/699 | 120 Smiths Lane Wongawilli NSW 2530 | 20 Sep 2024 |
| Residential - construction and Installation of a fibreglass swimming pool, spa and block retaining walls - Wollongong City Council DA-2024/493 | 33 Dairy Farm Way Wongawilli NSW 2530 | 04 Jul 2024 |
| Residential - Construction of detached dual occupancy and Torrens Title subdivision - Wollongong City Council DA-2024/488 | 2 Garreeaira Road Wongawilli NSW 2530 | 03 Jul 2024 |
| Residential - new detached dual occupancy and Torrens title subdivision - Wollongong City Council DA-2024/438 | 35 Wollindarra Circuit Wongawilli NSW 2530 | 16 Jun 2024 |
| Residential - detached outbuilding, retaining wall and swimming pool Modification A - relocate and raise floor level of shed, relocate swimming pool and deck, relocate retaining wall and relocate pool pump - Wollongong City Council DA-2022/1009/A | 9 Coral Vale Drive Wongawilli NSW 2530 | 30 Apr 2024 |
Planning Applications: Other (9)
| Headline | Place | Date |
|---|---|---|
| Operation of display village, signage, fences and amenities block Modification A - Amend condition 5 to enable an extension of the display village for a further 3 years - Wollongong City Council DA-2018/1372/A | 26 Wongawilli Road Wongawilli NSW 2530 | 29 Jan 2024 |
| Additions (roof cover) to existing cafe building - Wollongong City Council DA-2023/896 | 57 Smiths Lane Wongawilli NSW 2530 | 14 Nov 2023 |
| Residential - construction of dwelling house, garages, shed, swimming pool, retaining walls, landscaping, tree removal and on site effluent disposal Modification A - minor modifications to roof, pool, alfresco area and plantrooms - Wollongong City Council DA-2023/18/A | 5 Spring Hill Lane Wongawilli NSW 2530 | 01 Nov 2023 |
| Not used - disregard. Mb 23/8/23 - Wollongong City Council DA-2017/715/s4 | 57 Smiths Lane Wongawilli NSW 2530 | 25 Aug 2023 |
| Residential - alterations and additions to dwelling, additions to existing garage, demolition of existing swimming pool and construction of new swimming pool and pergola, and associated landscaping and siteworks Modification A - relocate swimming pool and internal changes to floor plan - Wollongong City Council DA-2021/1133/A | 150 Smiths Lane Wongawilli NSW 2530 | 18 May 2023 |
Median House Sale Prices by Street (100)
| Street | Date | Median sale value |
|---|---|---|
| Hayshed Ln | 10 May 2024 | $2,330,000 |
| Bankbook Dr | 10 May 2024 | $985,000 |
| Gerringulli | 10 May 2024 | $537,500 |
| Curlew St | 10 May 2024 | $1,120,000 |
| Monarch St | 10 May 2024 | $1,390,000 |
Recently Sold Houses (100)
| Address | Price | Bedrooms | Bathrooms | Garage spaces | Date sold | Subdivisible into | Sale Type |
|---|---|---|---|---|---|---|---|
| 12 Curlew St | $1,145,000 | 4.0 | 2.0 | 2.0 | 28 Feb 2025 | 0 | On Market |
| 12 Monarch St | $1,400,000 | 4.0 | 2.0 | 2.0 | 21 Feb 2025 | 0 | On Market |
| 36 Wollindarra Circuit | $790,000 | 0.0 | 0.0 | 0.0 | 28 Jan 2025 | 0 | On Market |
| 42 Wongawilli Rd | $600,000 | 0.0 | 0.0 | 0.0 | 27 Dec 2024 | 0 | On Market |
| 10 Curlew St | Price Withheld | 4.0 | 2.0 | 2.0 | 22 Nov 2024 | 0 | On Market |
Businesses (3)
| Name | Address |
|---|---|
| Raymond Vincent Homes | 16 Raven St, Wongawilli NSW 2530, Australia |
| ML Plaster Linings | |
| ML Plaster Linings |
Recent Rental Unit Listings (100)
| Address | Rent (per week) | Bedrooms | Bathrooms | Garage spaces | Date |
|---|---|---|---|---|---|
| 18a Curlew St | Price Withheld | 1.0 | 1.0 | 1.0 | 18 Aug 2021 |
| 18a Curlew St | Price Withheld | 1.0 | 1.0 | 1.0 | 18 Aug 2021 |
| 18a Curlew St | Price Withheld | 1.0 | 1.0 | 1.0 | 18 Aug 2021 |
| 18a Curlew St | Price Withheld | 1.0 | 1.0 | 1.0 | 18 Aug 2021 |
| 18a Curlew St | Price Withheld | 1.0 | 1.0 | 1.0 | 18 Aug 2021 |
Recent Rental House Listings (100)
| Address | Rent (per week) | Bedrooms | Bathrooms | Garage spaces | Date | Subdivisible into |
|---|---|---|---|---|---|---|
| 9 Thornbill St | $775 | 3 | 2 | 2 | 31 Jan 2025 | 0 |
| 9 Thornbill St | $775 | 3 | 2 | 2 | 31 Jan 2025 | 0 |
| 9 Thornbill St | $775 | 3 | 2 | 2 | 31 Jan 2025 | 0 |
| 8 Schoolyard Pl | $700 | 3 | 2 | 1 | 13 Jan 2025 | 0 |
| 8 Schoolyard Pl | $700 | 3 | 2 | 1 | 13 Jan 2025 | 0 |
Recently Sold Units (100)
| Address | Price | Bedrooms | Bathrooms | Garage spaces | Date sold | Sale Type |
|---|---|---|---|---|---|---|
| 36 Wollindarra Circuit | $790,000 | 0.0 | 0.0 | 0.0 | 28 Jan 2025 | On Market |
| 42 Wongawilli Rd | $600,000 | 0.0 | 0.0 | 0.0 | 27 Dec 2024 | On Market |
| 42 Wongawilli Rd | $600,000 | 0.0 | 0.0 | 0.0 | 27 Dec 2024 | On Market |
| 42 Wongawilli Rd | $600,000 | 0.0 | 0.0 | 0.0 | 27 Dec 2024 | On Market |
| 42 Wongawilli Rd | $600,000 | 0.0 | 0.0 | 0.0 | 27 Dec 2024 | On Market |
Loading entities ..