.png)
Profiles
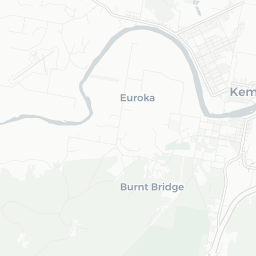
Nearby Suburbs
Real Estate Market: Is Yessabah NSW 2440 a Good Suburb to Buy Into?
Housing Market in Yessabah

Sources: Property Listings, TORREN and Microburbs, 2002 - 2023
| Field | Value | VS Mid North Coast NSW | Trend | |
|---|---|---|---|---|
| Premium | Premium | Premium | ||
| Premium | Premium | Premium | ||
| Premium | Premium | Premium | ||
| $624 | Top 41% |
|
||
| Premium | Premium | Premium |
Housing Supply in Yessabah

The higher the supply score the more supply is on the market, both current and future.
Sources: ABS, GEOSPATIAL, Property Listings, BASIX and Microburbs, 2002 - 2031
Sources: ABS, GEOSPATIAL, Property Listings, BASIX and Microburbs, 2002 - 2031
Yessabah
39.2%
Yessabah
39.2%
Mid North Coast NSW
41.1%
Mid North Coast NSW
41.1%
| Field | Value | VS Mid North Coast NSW | Trend | |
|---|---|---|---|---|
| 0 | Bottom 38% | Data for Jun 2025 | ||
| 2.2 | Bottom 49% | Data for Jul 2023 | ||
| Premium | Premium | Premium | ||
| Premium | Premium | Premium | ||
| Premium | Premium | Premium | ||
| 4 | Bottom 13% | Data for Dec 2017 | ||
| Premium | Premium | Premium | ||
| Premium | Premium | Premium | ||
| Premium | Premium | Premium | ||
| 0 | Bottom 26% | Data for Apr 2025 |
Housing Stock Quality in Yessabah
The higher the score, the higher the quality of the houses and units.
Sources: ABS, GEOSPATIAL, Property Listings, BASIX and Microburbs, 2006 - 2023
Sources: ABS, GEOSPATIAL, Property Listings, BASIX and Microburbs, 2006 - 2023
| Field | Value | VS Mid North Coast NSW | Trend | |
|---|---|---|---|---|
| 100.0% | Top 31% | Data for Jan 2021 | ||
| 2.7 | Top 30% |
|
||
| 0.0% | Bottom 37% | Data for Jun 2023 |
Development Restrictions in Yessabah

The higher the score, the more easily density can be increased.
Sources: GEOSPATIAL, TORREN and Microburbs, 2011 - 2023
Sources: GEOSPATIAL, TORREN and Microburbs, 2011 - 2023
Yessabah
28.0%
Yessabah
28.0%
Mid North Coast NSW
24.0%
Mid North Coast NSW
24.0%
| Field | Value | VS Mid North Coast NSW | Trend | |
|---|---|---|---|---|
| 0.0% | Bottom 31% | Data for Jun 2023 | ||
| 0 | Bottom 16% | Data for Jun 2023 |
Risk in Yessabah

The higher the score, the more exposed households are to financial stress.
Sources: ABS, Property Listings, TORREN and Microburbs, 2006 - 2023
Sources: ABS, Property Listings, TORREN and Microburbs, 2006 - 2023
Yessabah
42.8
Yessabah
42.8
Mid North Coast NSW
43.2
Mid North Coast NSW
43.2
| Field | Value | VS Mid North Coast NSW | Trend | |
|---|---|---|---|---|
| 100.0% | Top 11% | Data for May 2023 | ||
| 0.0% | Bottom 11% | Data for May 2023 | ||
| 50 | Top 14% | Data for Jun 2023 | ||
| $2,280 | Top 31% |
|
||
| 66 | Bottom 6% | Data for Jun 2023 | ||
| 61 | Bottom 5% | Data for Jun 2023 | ||
| 31.1% | Top 13% |
|
||
| 38.6% | Top 49% |
|
Housing Demand in Yessabah
The higher the score, the more demand their is for housing in the area, both current and future.
Sources: ABS, TORREN, Property Listings and Microburbs, 2006 - 2030
Sources: ABS, TORREN, Property Listings and Microburbs, 2006 - 2030
Yessabah
45.2%
Yessabah
45.2%
Mid North Coast NSW
60.8%
Mid North Coast NSW
60.8%
| Field | Value | VS Mid North Coast NSW | Trend | |
|---|---|---|---|---|
| Premium | Premium | Premium | ||
| Premium | Premium | Premium | ||
| 8720 | Bottom 37% |
|
||
| 52300 | Bottom 37% |
|
||
| Premium | Premium | Premium | ||
| 31300 | Top 35% |
|
||
| Premium | Premium | Premium | ||
| Premium | Premium | Premium | ||
| Premium | Premium | Premium |
Unit Market in Yessabah
Sources: Property Listings and Microburbs, 2002 - 2023
| Field | Value | VS Mid North Coast NSW | Trend | |
|---|---|---|---|---|
| Premium | Premium | Premium | ||
| $464 | Bottom 37% |
|
||
| Premium | Premium | Premium | ||
| 107.0% | Top 9% |
|
Percent of Renters by Street (9)
| Percent of Renters | Street |
|---|---|
| 0.0% | Callen-Brae Ln |
| 9.1% | Clarkes Rd |
| 0.0% | Commong Ln |
| 0.0% | Dungay Creek Rd |
| 0.0% | Gowings Hill Rd |
Turnover Rate by Street (8)
| Turnover rate | Street | Turnover Label | Turnover Years | Year |
|---|---|---|---|---|
| 45.5% | Yessabah Rd | very tightly held | Every 22.0 years (very tightly held) | 2025 |
| 200.0% | Gowings Hill Rd | very high turnover | Every 5.0 years (very high turnover) | 2025 |
| 80.0% | Dungay Creek Rd | average turnover | Every 12.5 years (average turnover) | 2025 |
| 75.0% | Callen-Brae Ln | average turnover | Every 13.3 years (average turnover) | 2025 |
| 100.0% | Clarkes Rd | high turnover | Every 10.0 years (high turnover) | 2025 |
Recently Sold Houses (15)
| Address | Price | Bedrooms | Bathrooms | Garage spaces | Date sold | Subdivisible into | Sale Type |
|---|---|---|---|---|---|---|---|
| 244 Dungay Creek Rd | $750,000 | 3.0 | 1.0 | 3.0 | 23 Mar 2023 | 0 | On Market |
| 244 Dungay Creek Rd | $750,000 | 23 Mar 2023 | 0 | On Market | |||
| 25 Ribbes Access | $910,000 | 3.0 | 1.0 | 7.0 | 17 Jan 2022 | 0 | On Market |
| 25 Ribbes Access | Price Withheld | 3.0 | 1.0 | 7.0 | 17 Jan 2022 | 0 | On Market |
| 204 Dungay Creek Rd | $620,000 | 3.0 | 1.0 | 9.0 | 11 Aug 2021 | 0 | On Market |
LGA Details (1)
| Headline | Place | Datetime |
|---|---|---|
| Local government area | Kempsey |
Recent Rental Unit Listings (100)
| Address | Rent (per week) | Bedrooms | Bathrooms | Garage spaces | Date |
|---|---|---|---|---|---|
| 226 Yessabah Rd | $320 | 30 Oct 2015 | |||
| 226 Yessabah Rd | $320 | 30 Oct 2015 | |||
| 226 Yessabah Rd | $320 | 30 Oct 2015 | |||
| 226 Yessabah Rd | $320 | 30 Oct 2015 | |||
| 226 Yessabah Rd | $320 | 30 Oct 2015 |
Median House Sale Prices by Street (4)
| Street | Date | Median sale value |
|---|---|---|
| Yessabah Rd | 06 Oct 2023 | $604,800 |
| Dungay Creek Rd | 06 Oct 2023 | $750,000 |
| Kullatine Dr | 06 Oct 2023 | $540,500 |
| Commong Ln | 06 Oct 2023 | $831,800 |
Recently Sold Units (100)
| Address | Price | Bedrooms | Bathrooms | Garage spaces | Date sold | Sale Type |
|---|---|---|---|---|---|---|
| 244 Dungay Creek Rd | $750,000 | 23 Mar 2023 | On Market | |||
| 244 Dungay Creek Rd | $750,000 | 3.0 | 1.0 | 3.0 | 23 Mar 2023 | On Market |
| 244 Dungay Creek Rd | $750,000 | 23 Mar 2023 | On Market | |||
| 244 Dungay Creek Rd | $750,000 | 3.0 | 1.0 | 3.0 | 23 Mar 2023 | On Market |
| 244 Dungay Creek Rd | $750,000 | 23 Mar 2023 | On Market |
Recent Rental House Listings (25)
| Address | Rent (per week) | Bedrooms | Bathrooms | Garage spaces | Date | Subdivisible into |
|---|---|---|---|---|---|---|
| 226 Yessabah Rd | $390 | 20 May 2020 | 0 | |||
| 226 Yessabah Rd | $390 | 20 May 2020 | 0 | |||
| 226 Yessabah Rd | $390 | 20 May 2020 | 0 | |||
| 226 Yessabah Rd | $390 | 20 May 2020 | 0 | |||
| 226 Yessabah Rd | $390 | 20 May 2020 | 0 |
Loading entities ..