Copyright Microburbs Pty Ltd 2014-
2025
.
Contact us
for licensing
Close
GET REPORT
New
Explorer
Profile Page
Logout
Sign Up
Login
Blog
Products
Subscriptions
Suburb Finder
Suburb Reports
Suburb DataExplorer
Free Data Consultation
API Access
Consulting Services
AI Property Finder
Coming Soon
Suburb Finder
2025 Suburb Reports
AI Property Finder
Profiles
People & Lifestyle
Crime & Disadvantage
Real Estate
Affluence & Economy
Environment
Nearby Suburbs
Glen Alice
Glen Davis
Round Swamp
Palmers Oaky
Running Stream
Bogee
Ben Bullen
Brogans Creek
Cullen Bullen
Mount Marsden
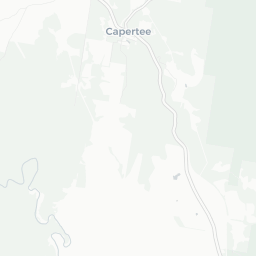
Is Capertee NSW 2846 a rich suburb?
Affluence in Capertee
The higher the score, the more wealthy, high income and financially free the population is.
Sources: ABS, ATO, DSS, GOOGLE, TORREN and Microburbs, 2001 - 2023
Capertee
36.0%
Capertee
36.0%
Central West NSW
52.1%
Central West NSW
52.1%
Compare
Suburbs
Field
Value
VS Central West NSW
Trend
Education score
4.7
Bottom 24%
Data for Jun 2022
Middle Class
27.5%
Bottom 6%
Data for May 2023
Underclass
19.6%
Top 9%
Data for May 2023
Upper Class
5.6%
Top 37%
Data for May 2023
Working Class
47.3%
Top 7%
Data for May 2023
Austudy Payments (SA2)
5
Bottom 32%
Data for Jun 2024
Commonwealth Rent Assistance (SA2)
340
Bottom 43%
Data for Jun 2024
Median household income (weekly)
$833
Bottom 10%
8% to Jan 2021
Pension Payments (SA2)
1140
Top 37%
Data for Jun 2024
Unemployed
3.5%
Top 19%
70% to Dec 2021
Business in Capertee
The higher the score, the more vibrant and diverse the regional economy.
Sources: ABS, GOOGLE, TORREN and Microburbs, 2016 - 2023
Capertee
97.3%
Capertee
97.3%
Central West NSW
87.5%
Central West NSW
87.5%
Compare
Suburbs
Field
Value
VS Central West NSW
Trend
Business Activity
53.0
Top 41%
Data for May 2023
Industry Diversity
83.3
Bottom 43%
Data for May 2023
Employment in Capertee
Sources: ABS, AURIN, SEEK and Microburbs, 2006 - 2022
Field
Value
VS Central West NSW
Trend
Labour force participation
46.1%
Bottom 17%
3% to Dec 2021
Businesses (15)
Name
Address
Bennett Electrical Solutions
Bennett Electrical Solutions
Bennett Electrical Solutions
Bennett Electrical Solutions
Bennett Electrical Solutions
Loading entities ..
+
−
Leaflet
Subscribe
to see the map content. See samples:
Surry Hills (NSW)
St Kilda (Vic.)
Fortitude Valley
Kent Town
Northbridge (WA)
Darwin City
Glenorchy (Tas.)
Expand ↗️
Loading Choropleth Data
Min
Max
Subscribe
to see the timeline. See samples:
Surry Hills (NSW)
St Kilda (Vic.)
Fortitude Valley
Kent Town
Northbridge (WA)
Darwin City
Glenorchy (Tas.)
Profiles
People & Lifestyle
Crime & Disadvantage
Real Estate
Affluence & Economy
Environment
Nearby Suburbs
Glen Alice
Glen Davis
Round Swamp
Palmers Oaky
Running Stream
Bogee
Ben Bullen
Brogans Creek
Cullen Bullen
Mount Marsden
.png)