Copyright Microburbs Pty Ltd 2014-
2025
.
Contact us
for licensing
Close
GET REPORT
New
Explorer
Profile Page
Logout
Sign Up
Login
Blog
Products
Subscriptions
Suburb Finder
Suburb Reports
Suburb DataExplorer
Free Data Consultation
API Access
Consulting Services
AI Property Finder
Coming Soon
Suburb Finder
2025 Suburb Reports
AI Property Finder
Profiles
People & Lifestyle
Crime & Disadvantage
Real Estate
Affluence & Economy
Environment
Nearby Suburbs
Oallen
Lower Boro
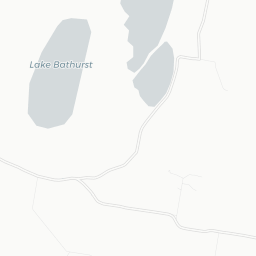
Lake Bathurst
Nerriga
Quialigo
Bungonia
Gundary
Tarago
Tirrannaville
Corang
Is Windellama NSW 2580 a rich suburb?
Affluence in Windellama
The higher the score, the more wealthy, high income and financially free the population is.
Sources: ABS, ATO, DSS, GOOGLE, TORREN and Microburbs, 2001 - 2023
Windellama
47.1%
Windellama
47.1%
Capital Region
56.2%
Capital Region
56.2%
Compare
Suburbs
Field
Value
VS Capital Region
Trend
Education score
5.1
Top 43%
2% to Jun 2022
Middle Class
44.4%
Bottom 28%
Data for May 2023
Underclass
14.2%
Top 38%
Data for May 2023
Upper Class
4.3%
Bottom 24%
Data for May 2023
Working Class
37.1%
Top 24%
Data for May 2023
Austudy Payments (SA2)
5
Bottom 32%
Data for Jun 2024
Commonwealth Rent Assistance (SA2)
475
Top 43%
Data for Jun 2024
Median household income (weekly)
$1,480
Bottom 48%
68% to Jan 2021
Pension Payments (SA2)
1570
Top 21%
Data for Jun 2024
Unemployed
2.1%
Top 25%
39% to Dec 2021
Business in Windellama
The higher the score, the more vibrant and diverse the regional economy.
Sources: ABS, GOOGLE, TORREN and Microburbs, 2016 - 2023
Windellama
100.0%
Windellama
100.0%
Capital Region
84.3%
Capital Region
84.3%
Compare
Suburbs
Field
Value
VS Capital Region
Trend
Industry Diversity
94.4
Top 22%
Data for May 2023
Employment in Windellama
Sources: ABS, AURIN, SEEK and Microburbs, 2006 - 2022
Field
Value
VS Capital Region
Trend
Labour force participation
49.0%
Bottom 21%
12% to Dec 2021
Affluence (1)
Headline
Place
Datetime
Cat and Cradle
9 Minshull Rd
Infrastructure (2)
Headline
Place
Datetime
Hi Quality Group
Businesses (3)
Name
Address
Cat and Cradle
9, Minshull Rd
J F Benison
3325, Windellama Rd
Cat and Cradle
9, Minshull Rd
Loading entities ..
+
−
Leaflet
Subscribe
to see the map content. See samples:
Surry Hills (NSW)
St Kilda (Vic.)
Fortitude Valley
Kent Town
Northbridge (WA)
Darwin City
Glenorchy (Tas.)
Expand ↗️
Loading Choropleth Data
Min
Max
Subscribe
to see the timeline. See samples:
Surry Hills (NSW)
St Kilda (Vic.)
Fortitude Valley
Kent Town
Northbridge (WA)
Darwin City
Glenorchy (Tas.)
Profiles
People & Lifestyle
Crime & Disadvantage
Real Estate
Affluence & Economy
Environment
Nearby Suburbs
Oallen
Lower Boro
Lake Bathurst
Nerriga
Quialigo
Bungonia
Gundary
Tarago
Tirrannaville
Corang
.png)