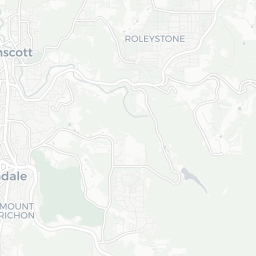
.png)
Profiles
Nearby Suburbs
What Kind of People Live in Kelmscott WA 6111?
Diversity Levels in Kelmscott
The proportion of the population who are not 3rd+ generation Anglo-Australians
Sources: ABS, TORREN and Microburbs, 2006 - 2023
Sources: ABS, TORREN and Microburbs, 2006 - 2023
Kelmscott
38.3%
Kelmscott
38.3%
Perth
44.8%
Perth
44.8%
| Field | Value | VS Perth | Trend | |
|---|---|---|---|---|
| 40 | Bottom 32% |
|
||
| Premium | Premium | Premium | ||
| Premium | Premium | Premium | ||
| 3.8% | Top 27% |
|
||
| 41.4% | Top 9% |
|
Quality of Life in Kelmscott

The proportion of residents who enjoy a healthy, satisfying life.
Sources: ABS, AIHW, DSS, GEOSPATIAL, GOOGLE, TORREN and Microburbs, 2006 - 2045
Sources: ABS, AIHW, DSS, GEOSPATIAL, GOOGLE, TORREN and Microburbs, 2006 - 2045
Kelmscott
75.0%
Kelmscott
75.0%
Perth
74.4%
Perth
74.4%
| Field | Value | VS Perth | Trend | |
|---|---|---|---|---|
| 15 | Top 21% | Data for Jun 2023 | ||
| 78 | Bottom 24% | Data for Dec 2016 | ||
| 71.0 | Bottom 26% | Data for May 2023 | ||
| 46.0 | Top 12% | Data for May 2023 | ||
| 99.5% | Top 3% | Data for May 2023 | ||
| Premium | Premium | Premium |
Conservatism in Kelmscott
The proportion of the population who hold traditional values.
Sources: ABS, AEC and Microburbs, 2006 - 2023
Sources: ABS, AEC and Microburbs, 2006 - 2023
Kelmscott
25.3%
Kelmscott
25.3%
Perth
28.1%
Perth
28.1%
| Field | Value | VS Perth | Trend | |
|---|---|---|---|---|
| 50.0% | Bottom 34% | Data for May 2023 | ||
| 73.7% | Bottom 31% |
|
||
| 27.3% | Bottom 6% | Data for Dec 2022 |
Convenience Score in Kelmscott

The higher the score, the faster the travel time to regular amenities like work and shopping and the easier it is to access them without private cars.
Sources: ABS, GEOSPATIAL, TORREN, GEOSERVER and Microburbs, 2006 - 2045
Sources: ABS, GEOSPATIAL, TORREN, GEOSERVER and Microburbs, 2006 - 2045
Kelmscott
71.0
Kelmscott
71.0
Perth
76.5
Perth
76.5
| Field | Value | VS Perth | Trend | |
|---|---|---|---|---|
| 2.0% | Top 7% |
|
||
| 1.8 | Bottom 37% |
|
||
| 0.2% | Top 21% |
|
||
| 26 km | Bottom 40% | Data for Mar 2023 | ||
| 1.0% | Bottom 45% |
|
Hip Score in Kelmscott
The higher the score, the more fashionable and lively an area is: a trendy, progressive population with easy access to nightlife and culture.
Sources: ABS, AEC, GOOGLE and Microburbs, 2006 - 2023
Sources: ABS, AEC, GOOGLE and Microburbs, 2006 - 2023
Kelmscott
58.0
Kelmscott
58.0
Perth
62.0
Perth
62.0
| Field | Value | VS Perth | Trend | |
|---|---|---|---|---|
| 57% | Bottom 31% | Data for Nov 2017 | ||
| 11 | Top 17% | Data for Aug 2023 | ||
| 0.0 | Bottom 43% | Data for May 2023 | ||
| 50.5% | Top 34% |
|
||
| 1.9% | Top 39% |
|
||
| 48.0% | Top 39% |
|
||
| 57.3% | Top 7% | Data for Dec 2022 | ||
| 0.2% | Top 14% |
|
Community Score in Kelmscott
The higher the score, the more time residents spend contributing the local community and the more connected residents are to their community.
Sources: ABS, GOOGLE and Microburbs, 2006 - 2023
Sources: ABS, GOOGLE and Microburbs, 2006 - 2023
Kelmscott
83.0
Kelmscott
83.0
Perth
86.5
Perth
86.5
| Field | Value | VS Perth | Trend | |
|---|---|---|---|---|
| 3.0 | Top 11% | Data for May 2023 | ||
| 95.4% | Top 32% | Data for Dec 2014 | ||
| 27.4% | Bottom 34% |
|
Family Score in Kelmscott
The higher the score, the more suitable the suburb is to families with children: good schools, safe, plentiful families, child-friendly amenities like playgrounds
Sources: ABS, DSS, TORREN and Microburbs, 2006 - 2023
Sources: ABS, DSS, TORREN and Microburbs, 2006 - 2023
Kelmscott
69.0
Kelmscott
69.0
Perth
77.6
Perth
77.6
| Field | Value | VS Perth | Trend | |
|---|---|---|---|---|
| 50 | Bottom 43% | Data for Dec 2022 | ||
| 200 | Top 33% | Data for Dec 2022 | ||
| 1620 | Top 11% |
|
||
| 66.6% | Bottom 35% |
|
||
| 7.3% | Top 16% |
|
||
| Premium | Premium | Premium |
Health Services (42)
| Headline | Place | Datetime |
|---|---|---|
| Hillview Colon Care Health Centre | 3 Boondi Pl | |
| AKMD Medical Centre | Unit 3/ 2944 Albany Hwy | |
| Armadale Kelmscott Nuclear Medicine | 3/2964 Albany Hwy | |
| Armitage Road Medical Centre | 3 Foster Rd | |
| Audika Kelmscott | Unit 6/2838 Albany Hwy |
Education (11)
| Headline | Place | Datetime |
|---|---|---|
| Aspire Dance Collections | Unit 5 2880 Albany Hwy | |
| Horseland Kelmscott | 2938 Albany Hwy | |
| John Wollaston Anglican Community School | Centre Rd Cnr Lake Rd | |
| Nile Family Day Care | Unit 36/ 12 Davis Rd | |
| Riverdale Child-Care & Community Centre | 57 River Rd |
Venues and Restaurants (26)
| Headline | Place | Datetime |
|---|---|---|
| Avocados | 2 Mount St | |
| Champion Lunch Bar | Unit 1/ 1 Brant Rd | |
| Chefmaster Australia | 219 Railway Ave | |
| Crust Gourmet Pizza Bar | Shop 14 2784 Albany Hwy | |
| Dominos Pizza | 4/ 2756 Albany Hwy |
Community Groups (10)
| Headline | Place | Datetime |
|---|---|---|
| Belrose Care | 89 Clifton St | |
| Crossways Community Services | 225 Railway Av | |
| Good Shepherd Catholic Church | 42 Streich Ave | |
| MercyCare Kelmscott | 89 Clifton St | |
| SOS Alarms |
Businesses (51)
| Headline | Place | Datetime |
|---|---|---|
| DECOR MOULDINGS and Picture Framing | Unit 5 23 Gillam Dr | |
| Roleystone Animal Hospital | 17 Page Rd | |
Recreational Facilities (6)
| Name | Address |
|---|---|
| Mr Revamp | u3/2 Keira St, Kelmscott WA 6111, Australia |
| Getaway Outdoors | 2936 Albany Hwy, Kelmscott WA 6111, Australia |
| David Birrell | 8/2 Gillam Dr, Kelmscott WA 6111, Australia |
| VideoEzy Kelmscott | 2850 Albany Hwy, Kelmscott WA 6111, Australia |
| Gemina Sports | 3/61 Owen Rd, Kelmscott WA 6111, Australia |
Tourism (1)
| Name | Address |
|---|---|
| Flight Centre Kelmscott | 14b/2865 Albany Hwy, Kelmscott WA 6111, Australia |
Loading entities ..