.png)
Profiles
Nearby Suburbs
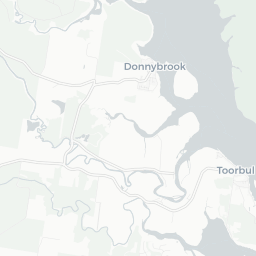
Real Estate Market: Is Donnybrook (Qld) QLD 4510 a Good Suburb to Buy Into?
Housing Market in Donnybrook (Qld)

Sources: Property Listings and Microburbs, 2002 - 2023
| Field | Value | VS Moreton Bay | Trend | |
|---|---|---|---|---|
| Premium | Premium | Premium | ||
| Premium | Premium | Premium | ||
| Premium | Premium | Premium | ||
| $621 | Top 40% |
|
||
| Premium | Premium | Premium |
Housing Supply in Donnybrook (Qld)

The higher the supply score the more supply is on the market, both current and future.
Sources: ABS, GEOSPATIAL, Property Listings, PLANNING ALERTS and Microburbs, 2002 - 2023
Sources: ABS, GEOSPATIAL, Property Listings, PLANNING ALERTS and Microburbs, 2002 - 2023
Donnybrook (Qld)
44.6%
Donnybrook (Qld)
44.6%
Moreton Bay
33.2%
Moreton Bay
33.2%
| Field | Value | VS Moreton Bay | Trend | |
|---|---|---|---|---|
| 0 | Bottom 38% |
|
||
| 1.2 | Bottom 34% | Data for Jul 2023 | ||
| 40.2 | Top 17% | Data for May 2023 | ||
| Premium | Premium | Premium | ||
| Premium | Premium | Premium | ||
| Premium | Premium | Premium | ||
| 2 lots | Bottom 13% |
|
||
| Premium | Premium | Premium | ||
| Premium | Premium | Premium | ||
| 5 | Top 24% |
|
Housing Stock Quality in Donnybrook (Qld)
The higher the score, the higher the quality of the houses and units.
Sources: ABS, GEOSPATIAL, Property Listings and Microburbs, 2006 - 2023
Sources: ABS, GEOSPATIAL, Property Listings and Microburbs, 2006 - 2023
| Field | Value | VS Moreton Bay | Trend | |
|---|---|---|---|---|
| 97.8% | Bottom 33% |
|
||
| 2.1 | Bottom 20% |
|
||
| 0.0% | Bottom 37% | Data for Jun 2023 |
Development Restrictions in Donnybrook (Qld)

The higher the score, the more easily density can be increased.
Sources: GEOSPATIAL, TORREN, ABS and Microburbs, 2011 - 2023
Sources: GEOSPATIAL, TORREN, ABS and Microburbs, 2011 - 2023
Donnybrook (Qld)
36.6%
Donnybrook (Qld)
36.6%
Moreton Bay
37.9%
Moreton Bay
37.9%
| Field | Value | VS Moreton Bay | Trend | |
|---|---|---|---|---|
| 4.9 sq km | Bottom 41% | Data for Jan 2021 | ||
| 0.0 sq km | Bottom 39% | Data for Jun 2023 | ||
| 800 sqm per resident | Bottom 40% | Data for Jan 2021 |
Risk in Donnybrook (Qld)

The higher the score, the more exposed households are to financial stress.
Sources: ABS, Property Listings, TORREN and Microburbs, 2006 - 2023
Sources: ABS, Property Listings, TORREN and Microburbs, 2006 - 2023
Donnybrook (Qld)
49.5
Donnybrook (Qld)
49.5
Moreton Bay
49.4
Moreton Bay
49.4
| Field | Value | VS Moreton Bay | Trend | |
|---|---|---|---|---|
| 85.9% | Bottom 29% |
|
||
| 14.1% | Top 29% |
|
||
| 43 | Top 22% | Data for Jun 2023 | ||
| $1,460 | Bottom 26% |
|
||
| 70 | Bottom 13% | Data for Jun 2023 | ||
| 67 | Bottom 14% | Data for Jun 2023 | ||
| 30.9% | Top 14% |
|
||
| 29.7% | Bottom 25% |
|
Housing Demand in Donnybrook (Qld)
The higher the score, the more demand their is for housing in the area, both current and future.
Sources: ABS, TORREN, Property Listings and Microburbs, 2006 - 2030
Sources: ABS, TORREN, Property Listings and Microburbs, 2006 - 2030
Donnybrook (Qld)
62.9%
Donnybrook (Qld)
62.9%
Moreton Bay
77.8%
Moreton Bay
77.8%
| Field | Value | VS Moreton Bay | Trend | |
|---|---|---|---|---|
| Premium | Premium | Premium | ||
| Premium | Premium | Premium | ||
| 18900 | Top 15% |
|
||
| 39200 | Bottom 23% |
|
||
| Premium | Premium | Premium | ||
| 578000 | Top 1% |
|
||
| Premium | Premium | Premium | ||
| Premium | Premium | Premium | ||
| Premium | Premium | Premium |
Unit Market in Donnybrook (Qld)
Sources: Property Listings and Microburbs, 2002 - 2023
| Field | Value | VS Moreton Bay | Trend | |
|---|---|---|---|---|
| Premium | Premium | Premium | ||
| 45.1% | Bottom 5% |
|
Median House Rental Prices by Street (3)
| Level_0 | Street | Date | Median rent (per week) |
|---|---|---|---|
| 135702 | Fletcher St | 13 Mar 2025 | $600 |
| 136165 | Serenity Cr | 13 Mar 2025 | $585 |
| 76976 | Maud St | 15 Jan 2025 | $900 |
Recently Sold Houses (100)
| Address | Price | Bedrooms | Bathrooms | Garage spaces | Date sold | Subdivisible into | Sale Type |
|---|---|---|---|---|---|---|---|
| 71 Alice St | $640,000 | 3.0 | 1.0 | 1.0 | 31 Jan 2025 | 0 | On Market |
| 15 Serenity Cr | $765,000 | 4.0 | 2.0 | 2.0 | 20 Jan 2025 | 0 | On Market |
| 7 Sunnyside Cr | Price Withheld | 3.0 | 1.0 | 2.0 | 10 Dec 2024 | 0 | On Market |
| 22 Maud St | $740,000 | 3.0 | 2.0 | 3.0 | 04 Dec 2024 | 0 | On Market |
| 17 Maud St | $820,000 | 4.0 | 1.0 | 5.0 | 03 Dec 2024 | 0 | On Market |
Planning Applications: Dwellings (11)
| Headline | Place | Date |
|---|---|---|
| Superseded Planning Scheme Request, and Concurrence Agency Referral for Dwelling House - Moreton Bay Regional Council DA/2024/5670 | 83 Alice Street Donnybrook QLD 4510 | 10 Dec 2024 |
| MCU Residential Uses Category 2 (Code Assessment) | Application Details | Material Change of Use | Dwelling House | Development Permit Development Application (Default category) - Moreton Bay Regional Council DA/2023/3347 | 7 Fletcher Street Donnybrook QLD 4510 | 26 Aug 2023 |
| MCU Residential Uses Category 2 (Code Assessment) | Application Details | Material Change of Use | Dwelling House | Development Permit Development Application (Default category) - Moreton Bay Regional Council DA/2023/2826 | 18 Fletcher Street Donnybrook QLD 4510 | 20 Jul 2023 |
| Change to Development Approval (Minor) | Change/Extension Application Details | Change involving Amendment/s to building envelopes, or Dwelling house, or Operational Works, or Changes to plan references only | Development Permit Development Application - Change and/or Extension to Approval (Default category) - Moreton Bay Regional Council DA/2023/2299 | 83 Alice Street Donnybrook QLD 4510 | 16 Jun 2023 |
| Building Works - Development Permit for Dwelling House (Removal dwelling) - assessed against the Planning Scheme - Moreton Bay Regional Council DA/2023/1438 | 29 Amy Street Donnybrook QLD 4510 | 20 Apr 2023 |
Planning Applications: Other (9)
| Headline | Place | Date |
|---|---|---|
| Electrical Reticulation and/or Street Lighting | Operational Works | Application Details | Related Development Approval | Development Permit Development Application (Default category) - Moreton Bay Regional Council DA/2024/2772 | 89 Ann Street Donnybrook QLD 4510 | 27 Jun 2024 |
| Building Works (not associated with a Material Change of Use) | Application Details | Building Works - Domestic | Development Permit Development Application (Default category) - Moreton Bay Regional Council DA/2023/3909 | 3 The Esplanade South Donnybrook QLD 4510 | 04 Oct 2023 |
| Extension of Currency Period - Other than Operational Work | Change/Extension Application Details | Development Permit Development Application - Change and/or Extension to Approval (Default category) - Moreton Bay Regional Council DA/2023/3252 | 83 Alice Street Donnybrook QLD 4510 | 19 Aug 2023 |
| Operational Works - Development Permit for Electrical Reticulation - Moreton Bay Regional Council DA/2023/0854 | 83 Alice Street Donnybrook QLD 4510 | 14 Mar 2023 |
| Reconfiguring a Lot | Application Details | Development Permit | Boundary Realignment/Relocation (where not associated with creating additional lots) Development Application (Default category) - Moreton Bay Regional Council DA/2023/0478 | 26 Alice Street Donnybrook QLD 4510 | 15 Feb 2023 |
LGA Details (1)
| Headline | Place | Datetime |
|---|---|---|
| Local government area | Moreton Bay |
Businesses (3)
| Name | Address |
|---|---|
| Total Painting Service | 41 Maud St, Donnybrook QLD 4510, Australia |
| Donnybrook Sports & Community Club | 11 Amy St, Donnybrook QLD 4510, Australia |
| J.C & K.K Van Beelen | 335, Donnybrook Rd |
Turnover Rate by Street (23)
| Turnover rate | Street | Turnover Label | Turnover Years | Year |
|---|---|---|---|---|
| 28.6% | Jody Ct | very tightly held | Every 35.0 years (very tightly held) | 2025 |
| 57.1% | Sunnyside Cr | quite tightly held | Every 17.5 years (quite tightly held) | 2025 |
| 80.0% | Donnybrook Rd | average turnover | Every 12.5 years (average turnover) | 2025 |
| 109.1% | Fletcher St | very high turnover | Every 9.2 years (very high turnover) | 2025 |
| 95.0% | Fisherman Dr | high turnover | Every 10.5 years (high turnover) | 2025 |
Percent of Renters by Street (22)
| Percent of Renters | Street |
|---|---|
| 26.1% | Alice St |
| 0.0% | Alison Ct |
| 12.3% | Amy St |
| 6.4% | Anglers Ct |
| 0.0% | Ann St |
Median House Sale Prices by Street (100)
| Street | Date | Median sale value |
|---|---|---|
| Alice St | 10 May 2024 | $809,500 |
| Anglers Ct | 10 May 2024 | $700,000 |
| Amy St | 10 May 2024 | $670,000 |
| Fisherman Dr | 10 May 2024 | $540,000 |
| Mary St | 10 May 2024 | $692,500 |
Recent Rental House Listings (100)
| Address | Rent (per week) | Bedrooms | Bathrooms | Garage spaces | Date | Subdivisible into |
|---|---|---|---|---|---|---|
| 29 Esplanade South | $860 | 5 | 2 | 4 | 04 Sep 2024 | 0 |
| 29 Esplanade South | $860 | 5 | 2 | 4 | 04 Sep 2024 | 0 |
| 29 Esplanade South | $860 | 5 | 2 | 4 | 04 Sep 2024 | 0 |
| 29 Esplanade South | $860 | 5 | 2 | 4 | 04 Sep 2024 | 0 |
| 29 Esplanade South | $860 | 5 | 2 | 4 | 04 Sep 2024 | 0 |
Recent Rental Unit Listings (100)
| Address | Rent (per week) | Bedrooms | Bathrooms | Garage spaces | Date |
|---|---|---|---|---|---|
| 245 Donnybrook Rd | $600 | 3.0 | 1.0 | 2.0 | 22 Aug 2024 |
| 245 Donnybrook Rd | $600 | 3.0 | 1.0 | 2.0 | 22 Aug 2024 |
| 245 Donnybrook Rd | $600 | 3.0 | 1.0 | 2.0 | 22 Aug 2024 |
| 245 Donnybrook Rd | $600 | 3.0 | 1.0 | 2.0 | 22 Aug 2024 |
| 245 Donnybrook Rd | $600 | 3.0 | 1.0 | 2.0 | 22 Aug 2024 |
Recently Sold Units (100)
| Address | Price | Bedrooms | Bathrooms | Garage spaces | Date sold | Sale Type |
|---|---|---|---|---|---|---|
| 34-108 Meldale Rd | Price Withheld | 6.0 | 3.0 | 4.0 | 19 Apr 2024 | On Market |
| 34-108 Meldale Rd | Price Withheld | 6.0 | 3.0 | 4.0 | 19 Apr 2024 | On Market |
| 34-108 Meldale Rd | Price Withheld | 6.0 | 3.0 | 4.0 | 19 Apr 2024 | On Market |
| 34-108 Meldale Rd | Price Withheld | 6.0 | 3.0 | 4.0 | 19 Apr 2024 | On Market |
| 34-108 Meldale Rd | Price Withheld | 6.0 | 3.0 | 4.0 | 19 Apr 2024 | On Market |
Loading entities ..