.png)
Profiles
Nearby Suburbs
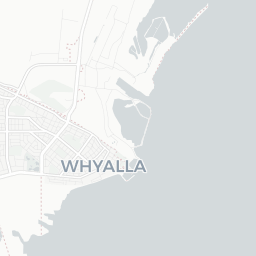
Real Estate Market: Is Douglas Point SA 5601 a Good Suburb to Buy Into?
Housing Market in Douglas Point

Sources: Property Listings and Microburbs, 2002 - 2023
| Field | Value | VS Regional SA | Trend | |
|---|---|---|---|---|
| Premium | Premium | Premium | ||
| $259 | Bottom 7% |
|
||
| Premium | Premium | Premium |
Housing Supply in Douglas Point

The higher the supply score the more supply is on the market, both current and future.
Sources: ABS, GEOSPATIAL, Property Listings, PLANNING ALERTS and Microburbs, 2002 - 2023
Sources: ABS, GEOSPATIAL, Property Listings, PLANNING ALERTS and Microburbs, 2002 - 2023
Douglas Point
46.0%
Douglas Point
46.0%
Regional SA
46.5%
Regional SA
46.5%
| Field | Value | VS Regional SA | Trend | |
|---|---|---|---|---|
| 0 | Bottom 34% | Data for Jun 2018 | ||
| Premium | Premium | Premium | ||
| Premium | Premium | Premium | ||
| Premium | Premium | Premium |
Housing Stock Quality in Douglas Point
The higher the score, the higher the quality of the houses and units.
Sources: ABS, GEOSPATIAL, Property Listings and Microburbs, 2006 - 2023
Sources: ABS, GEOSPATIAL, Property Listings and Microburbs, 2006 - 2023
| Field | Value | VS Regional SA | Trend | |
|---|---|---|---|---|
| 100.0% | Top 31% | Data for Jan 2021 | ||
| 2.1 | Bottom 20% |
|
||
| 0.0% | Top 25% | Data for Jun 2023 |
Development Restrictions in Douglas Point

The higher the score, the more easily density can be increased.
Sources: GEOSPATIAL, TORREN and Microburbs, 2011 - 2023
Sources: GEOSPATIAL, TORREN and Microburbs, 2011 - 2023
Douglas Point
23.7%
Douglas Point
23.7%
Regional SA
27.5%
Regional SA
27.5%
| Field | Value | VS Regional SA | Trend |
|---|
Risk in Douglas Point

The higher the score, the more exposed households are to financial stress.
Sources: ABS, Property Listings, TORREN and Microburbs, 2006 - 2023
Sources: ABS, Property Listings, TORREN and Microburbs, 2006 - 2023
Douglas Point
41.0
Douglas Point
41.0
Regional SA
33.7
Regional SA
33.7
| Field | Value | VS Regional SA | Trend | |
|---|---|---|---|---|
| 26.6% | Top 27% |
|
Housing Demand in Douglas Point
The higher the score, the more demand their is for housing in the area, both current and future.
Sources: ABS, TORREN, Property Listings and Microburbs, 2006 - 2030
Sources: ABS, TORREN, Property Listings and Microburbs, 2006 - 2030
Douglas Point
29.4%
Douglas Point
29.4%
Regional SA
37.0%
Regional SA
37.0%
| Field | Value | VS Regional SA | Trend | |
|---|---|---|---|---|
| Premium | Premium | Premium | ||
| Premium | Premium | Premium | ||
| 4620 | Bottom 15% |
|
||
| 59200 | Bottom 44% |
|
||
| 20100 | Top 42% |
|
||
| Premium | Premium | Premium | ||
| Premium | Premium | Premium |
Planning Applications: Other (7)
| Headline | Place | Date |
|---|---|---|
| Ezy Dump installation and associated signage and bollards - South Australia Planning Portal 22018587 | Lot 115 Fitzgerald Bay Rd Fitzgerald Bay SA 5601 | 27 Jul 2022 |
| Trail signage. - South Australia Planning Portal 21009720 | Lot 115 Fitzgerald Bay Rd Fitzgerald Bay SA 5601 | 11 Nov 2021 |
| Interpretative signage. - South Australia Planning Portal 21009681 | Lot 50 Fitzgerald Bay Rd Port Bonython SA 5601 | 11 Nov 2021 |
| Interpretative signage - South Australia Planning Portal 21013269 | Lot 115 Fitzgerald Bay Rd Fitzgerald Bay SA 5601 | 03 Nov 2021 |
| Walking trail - 2x Information signs and 4x interpretive signs 1, 5, 6, and 7. - South Australia Planning Portal 21013231 | Lot 112 Gulf View Dr Fitzgerald Bay SA 5601 | 03 Nov 2021 |
Planning Applications: Dwellings (1)
| Headline | Place | Date |
|---|---|---|
| Single storey detached dwelling with verandahs and decking - South Australia Planning Portal 21021497 | 2 Sea Heath View Douglas Point SA 5601 | 12 Aug 2021 |
LGA Details (1)
| Headline | Place | Datetime |
|---|---|---|
| Local government area | Whyalla |
Businesses (6)
| Name | Address |
|---|---|
| Johnson Home Improvements | |
| Johnson Home Improvements | |
| Johnson Home Improvements | |
| Eyre Peninsula Fire & Safety | |
| Eyre Peninsula Fire & Safety |
Accommodation Options (1)
| Name | Address |
|---|---|
| Airport Whyalla | Lincoln Hwy |
Percent of Renters by Street (18)
| Percent of Renters | Street |
|---|---|
| 0.0% | Black Oak Cove |
| 0.0% | Bluebush Pl |
| 0.0% | Cypress Cove |
| 0.0% | Eight Mile Creek Rd |
| 0.0% | Fanflower Frontage |
Turnover Rate by Street (17)
| Turnover rate | Street | Turnover Label | Turnover Years | Year |
|---|---|---|---|---|
| 66.7% | Karkalla Cove | quite tightly held | Every 15.0 years (quite tightly held) | 2025 |
| 40.0% | Fanflower Frontage | very tightly held | Every 25.0 years (very tightly held) | 2025 |
| 25.0% | Black Oak Cove | very tightly held | Every 40.0 years (very tightly held) | 2025 |
| 40.0% | Gulf View Dr | very tightly held | Every 25.0 years (very tightly held) | 2025 |
| 88.9% | Quandong Dr | high turnover | Every 11.2 years (high turnover) | 2025 |
Recently Sold Houses (14)
| Address | Price | Bedrooms | Bathrooms | Garage spaces | Date sold | Subdivisible into | Sale Type |
|---|---|---|---|---|---|---|---|
| 17 Quandong Dr | $605,000 | 3.0 | 1.0 | 30 Jul 2024 | 0 | On Market | |
| 17 Quandong Dr | $605,000 | 3.0 | 1.0 | 11 Jul 2024 | 0 | On Market | |
| 78 Gulf View Dr | $255,000 | 1.0 | 1.0 | 4.0 | 04 Nov 2022 | 0 | On Market |
| 78 Gulf View Dr | $255,000 | 1.0 | 1.0 | 04 Nov 2022 | 0 | On Market | |
| 78 Gulf View Dr | $255,000 | 1.0 | 1.0 | 5.0 | 04 Nov 2022 | 0 | On Market |
Median House Sale Prices by Street (100)
| Street | Date | Median sale value |
|---|---|---|
| Quandong Dr | 06 Oct 2023 | $650,000 |
| Gulf View Dr | 31 May 2024 | 292100.0 |
| Karkalla Cove | 31 May 2024 | 178400.0 |
| Quandong Dr | 31 May 2024 | 519200.0 |
| Gulf View Dr | 30 Jun 2024 | 334800.0 |
Recently Sold Units (100)
| Address | Price | Bedrooms | Bathrooms | Garage spaces | Date sold | Sale Type |
|---|---|---|---|---|---|---|
| 1 Murrnong Edge | Price Withheld | 1.0 | 10 Feb 2023 | On Market | ||
| 1 Murrnong Edge | Price Withheld | 1.0 | 10 Feb 2023 | On Market | ||
| 1 Murrnong Edge | Price Withheld | 1.0 | 10 Feb 2023 | On Market | ||
| 1 Murrnong Edge | Price Withheld | 1.0 | 10 Feb 2023 | On Market | ||
| 1 Murrnong Edge | Price Withheld | 1.0 | 10 Feb 2023 | On Market |
Loading entities ..