.png)
Profiles
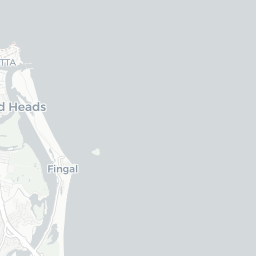
Nearby Suburbs
Real Estate Market: Is Fingal Head NSW 2487 a Good Suburb to Buy Into?
Housing Market in Fingal Head

Sources: Property Listings, TORREN and Microburbs, 2002 - 2023
| Field | Value | VS Richmond | Trend | |
|---|---|---|---|---|
| Premium | Premium | Premium | ||
| Premium | Premium | Premium | ||
| Premium | Premium | Premium | ||
| $1,100 | Top 3% |
|
||
| Premium | Premium | Premium |
Housing Supply in Fingal Head

The higher the supply score the more supply is on the market, both current and future.
Sources: ABS, GEOSPATIAL, Property Listings, PLANNING ALERTS, BASIX and Microburbs, 2002 - 2031
Sources: ABS, GEOSPATIAL, Property Listings, PLANNING ALERTS, BASIX and Microburbs, 2002 - 2031
Fingal Head
44.0%
Fingal Head
44.0%
Richmond
36.4%
Richmond
36.4%
| Field | Value | VS Richmond | Trend | |
|---|---|---|---|---|
| 1,040 | Top 5% |
|
||
| 3.8 | Top 36% | Data for Jul 2023 | ||
| 83.0 | Top 4% | Data for May 2023 | ||
| Premium | Premium | Premium | ||
| Premium | Premium | Premium | ||
| Premium | Premium | Premium | ||
| 2 | Bottom 14% |
|
||
| 2 lots | Bottom 16% | Data for Apr 2022 | ||
| Premium | Premium | Premium | ||
| Premium | Premium | Premium | ||
| Premium | Premium | Premium | ||
| 1 | Top 44% |
|
Housing Stock Quality in Fingal Head
The higher the score, the higher the quality of the houses and units.
Sources: ABS, GEOSPATIAL, Property Listings, BASIX and Microburbs, 2006 - 2023
Sources: ABS, GEOSPATIAL, Property Listings, BASIX and Microburbs, 2006 - 2023
| Field | Value | VS Richmond | Trend | |
|---|---|---|---|---|
| 81.9% | Bottom 14% |
|
||
| 2.6 | Top 39% |
|
||
| 9.7% | Top 15% | Data for Jun 2023 | ||
| Premium | Premium | Premium |
Development Restrictions in Fingal Head

The higher the score, the more easily density can be increased.
Sources: GEOSPATIAL, TORREN, ABS and Microburbs, 2011 - 2023
Sources: GEOSPATIAL, TORREN, ABS and Microburbs, 2011 - 2023
Fingal Head
27.5%
Fingal Head
27.5%
Richmond
30.9%
Richmond
30.9%
| Field | Value | VS Richmond | Trend | |
|---|---|---|---|---|
| 5.2 sq km | Bottom 42% | Data for Jan 2021 | ||
| 0.85 | Top 33% | Data for Feb 2023 | ||
| 0.0% | Bottom 31% | Data for Jun 2023 | ||
| 3 | Top 36% | Data for Jun 2023 | ||
| 2130 sqm per resident | Top 40% | Data for Jan 2021 |
Risk in Fingal Head

The higher the score, the more exposed households are to financial stress.
Sources: ABS, Property Listings, TORREN and Microburbs, 2006 - 2023
Sources: ABS, Property Listings, TORREN and Microburbs, 2006 - 2023
Fingal Head
63.5%
Fingal Head
63.5%
Richmond
62.3%
Richmond
62.3%
| Field | Value | VS Richmond | Trend | |
|---|---|---|---|---|
| 82.3% | Bottom 21% |
|
||
| 17.7% | Top 21% |
|
||
| 75 | Top 2% | Data for Jun 2023 | ||
| $1,850 | Bottom 45% | Data for May 2023 | ||
| 58 | Bottom 2% | Data for Jun 2023 | ||
| 63 | Bottom 7% | Data for Jun 2023 | ||
| 33.5% | Top 9% |
|
||
| 25.8% | Bottom 16% |
|
Housing Demand in Fingal Head
The higher the score, the more demand their is for housing in the area, both current and future.
Sources: ABS, TORREN, Property Listings and Microburbs, 1975 - 2030
Sources: ABS, TORREN, Property Listings and Microburbs, 1975 - 2030
Fingal Head
72.3%
Fingal Head
72.3%
Richmond
68.5%
Richmond
68.5%
| Field | Value | VS Richmond | Trend | |
|---|---|---|---|---|
| Premium | Premium | Premium | ||
| Premium | Premium | Premium | ||
| 23600 | Top 12% |
|
||
| 99000 | Top 28% |
|
||
| Premium | Premium | Premium | ||
| 110000 | Top 15% |
|
||
| Premium | Premium | Premium | ||
| Premium | Premium | Premium | ||
| Premium | Premium | Premium |
Unit Market in Fingal Head
Sources: Property Listings and Microburbs, 2002 - 2023
| Field | Value | VS Richmond | Trend | |
|---|---|---|---|---|
| Premium | Premium | Premium | ||
| $734 | Top 6% |
|
||
| Premium | Premium | Premium | ||
| 50.2% | Bottom 11% |
|
LGA Details (1)
| Headline | Place | Datetime |
|---|---|---|
| Local government area | Tweed |
Median House Rental Prices by Street (3)
| Level_0 | Street | Date | Median rent (per week) |
|---|---|---|---|
| 86368 | Fingal Rd | 13 Mar 2025 | $1,145 |
| 86188 | Bambery St | 13 Mar 2025 | $1,500 |
| 86497 | Main Rd | 13 Mar 2025 | $835 |
Percent of Renters by Street (17)
| Percent of Renters | Street |
|---|---|
| 9.8% | Bambery St |
| 14.5% | Chitticks Ln |
| 0.0% | Crown St |
| 19.5% | Dune St |
| 40.5% | Elizabeth St |
Turnover Rate by Street (15)
| Turnover rate | Street | Turnover Label | Turnover Years | Year |
|---|---|---|---|---|
| 150.0% | Healy Ln | very high turnover | Every 6.7 years (very high turnover) | 2025 |
| 68.4% | Letitia Rd | average turnover | Every 14.6 years (average turnover) | 2025 |
| 75.7% | Fingal Rd | average turnover | Every 13.2 years (average turnover) | 2025 |
| 76.9% | Dune St | average turnover | Every 13.0 years (average turnover) | 2025 |
| 125.0% | Wommin Lake Cr | very high turnover | Every 8.0 years (very high turnover) | 2025 |
Median Unit Sale Prices by Street (64)
| Date | Median sale value | Street |
|---|---|---|
| 30 Jun 2024 | 118900.0 | Elizabeth St |
| 31 May 2024 | 697800.0 | Elizabeth St |
| 31 May 2024 | 2248000.0 | Main Rd |
| 30 Jun 2024 | 1240000.0 | Main Rd |
| 30 Jun 2024 | 714100.0 | Elizabeth St |
Recently Sold Houses (100)
| Address | Price | Bedrooms | Bathrooms | Garage spaces | Date sold | Subdivisible into | Sale Type |
|---|---|---|---|---|---|---|---|
| 7 Bambery St | Price Withheld | 3.0 | 2.0 | 1.0 | 19 Feb 2025 | 0 | On Market |
| 53 Fingal Rd | $1,300,000 | 2.0 | 2.0 | 1.0 | 11 Dec 2024 | 0 | On Market |
| 53 Fingal Rd | Price Withheld | 2.0 | 2.0 | 1.0 | 11 Dec 2024 | 0 | On Market |
| Unit 1, 16 Healy Ln | $1,450,000 | 4.0 | 2.0 | 2.0 | 20 Sep 2024 | 0 | On Market |
| 2 Fingal Rd | $1,140,000 | 3.0 | 1.0 | 1.0 | 12 Sep 2024 | 0 | On Market |
Accommodation Options (1)
| Name | Address |
|---|---|
| Wommin Bay Hostel | McKissock Dr |
Businesses (1)
| Name | Address |
|---|---|
| Coleman's Fencing (Aust) Pty Ltd | 10B Marine Parade |
Planning Applications: Dwellings (27)
| Headline | Place | Date |
|---|---|---|
| Amendment to Development Consent DA18/0543 for two storey dwelling with attached garage and in-ground swimming pool - Tweed Shire Council DA18/0543.03 | 2 Lagoon Road, Fingal Head NSW 2487 | 25 Jul 2024 |
| Alterations and additions to existing dwelling including carport, spa and lift - Tweed Shire Council DA24/0270 | 56 Fingal Road, Fingal Head NSW 2487 | 03 Jul 2024 |
| Demolition of existing structures, two storey dwelling, carport, garage and in-ground pool - Tweed Shire Council DA24/0231 | 27 Queen Street, Fingal Head NSW 2487 | 21 Jun 2024 |
| Demolition of existing dwelling, new dual occupancy (attached) and strata subdivision - Tweed Shire Council DA24/0069 | 3 King Street, Fingal Head NSW 2487 | 08 Mar 2024 |
| Two storey dwelling with attached garage, carport and in-ground swimming pool - Tweed Shire Council DA24/0073 | 8 Chitticks Lane, Fingal Head NSW 2487 | 07 Mar 2024 |
Planning Applications: Other (16)
| Headline | Place | Date |
|---|---|---|
| Amendment to Development Consent DA18/0543 for two storey dwelling with attached garage and in-ground swimming pool - Tweed Shire Council DA18/0543.03 | 2 Lagoon Road, Fingal Head NSW 2487 | 25 Jul 2024 |
| Alterations and additions to existing dwelling including carport, spa and lift - Tweed Shire Council DA24/0270 | 56 Fingal Road, Fingal Head NSW 2487 | 03 Jul 2024 |
| Demolition of existing structures, two storey dwelling, carport, garage and in-ground pool - Tweed Shire Council DA24/0231 | 27 Queen Street, Fingal Head NSW 2487 | 21 Jun 2024 |
| Two storey dwelling with attached garage, carport and in-ground swimming pool - Tweed Shire Council DA24/0073 | 8 Chitticks Lane, Fingal Head NSW 2487 | 07 Mar 2024 |
| Demolition of existing dwelling, new dwelling and attached garage - Tweed Shire Council DA23/0603 | 1 A Letitia Road, Fingal Head NSW 2487 | 27 Nov 2023 |
Median House Sale Prices by Street (100)
| Street | Date | Median sale value |
|---|---|---|
| Chitticks Ln | 06 Oct 2023 | $1,052,000 |
| Fingal Rd | 10 May 2024 | $1,795,000 |
| Main Rd | 10 May 2024 | $1,850,000 |
| Bambery St | 06 Oct 2023 | $1,224,000 |
| Lighthouse Pde | 06 Oct 2023 | $582,900 |
Recent Rental Unit Listings (100)
| Address | Rent (per week) | Bedrooms | Bathrooms | Garage spaces | Date |
|---|---|---|---|---|---|
| Unit 4, 33 Queen St | $580 | 2.0 | 1.0 | 1.0 | 23 Jul 2024 |
| Unit 4, 33 Queen St | $580 | 2.0 | 1.0 | 1.0 | 23 Jul 2024 |
| Unit 4, 33 Queen St | $580 | 2.0 | 1.0 | 1.0 | 23 Jul 2024 |
| Unit 4, 33 Queen St | $580 | 2.0 | 1.0 | 1.0 | 23 Jul 2024 |
| Unit 4, 33 Queen St | $580 | 2.0 | 1.0 | 1.0 | 23 Jul 2024 |
Recent Rental House Listings (100)
| Address | Rent (per week) | Bedrooms | Bathrooms | Garage spaces | Date | Subdivisible into |
|---|---|---|---|---|---|---|
| Unit 5, 48 Main Rd | $820 | 3 | 2 | 1 | 01 Nov 2024 | 0 |
| Unit 5, 48 Main Rd | $820 | 3 | 2 | 1 | 01 Nov 2024 | 0 |
| Unit 5, 48 Main Rd | $820 | 3 | 2 | 1 | 01 Nov 2024 | 0 |
| Unit 5, 48 Main Rd | $820 | 3 | 2 | 1 | 01 Nov 2024 | 0 |
| Unit 5, 48 Main Rd | $820 | 3 | 2 | 1 | 01 Nov 2024 | 0 |
Recently Sold Units (100)
| Address | Price | Bedrooms | Bathrooms | Garage spaces | Date sold | Sale Type |
|---|---|---|---|---|---|---|
| Unit 1, 16 Healy Ln | $1,450,000 | 4.0 | 2.0 | 2.0 | 20 Sep 2024 | On Market |
| Unit 1, 16 Healy Ln | $1,450,000 | 4.0 | 2.0 | 2.0 | 20 Sep 2024 | On Market |
| Unit 1, 16 Healy Ln | $1,450,000 | 4.0 | 2.0 | 2.0 | 20 Sep 2024 | On Market |
| Unit 1, 16 Healy Ln | $1,450,000 | 4.0 | 2.0 | 2.0 | 20 Sep 2024 | On Market |
| Unit 1, 16 Healy Ln | $1,450,000 | 4.0 | 2.0 | 2.0 | 20 Sep 2024 | On Market |
Loading entities ..