.png)
Profiles
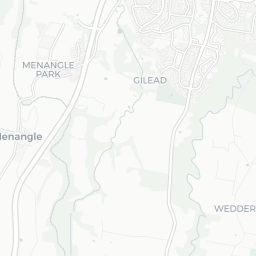
Nearby Suburbs
Real Estate Market: Is Gilead NSW 2560 a Good Suburb to Buy Into?
Housing Market in Gilead

Sources: Property Listings and Microburbs, 2002 - 2023
| Field | Value | VS Sydney | Trend | |
|---|---|---|---|---|
| Premium | Premium | Premium | ||
| Premium | Premium | Premium | ||
| Premium | Premium | Premium | ||
| $618 | Top 41% |
|
||
| Premium | Premium | Premium |
Housing Supply in Gilead

The higher the supply score the more supply is on the market, both current and future.
Sources: ABS, GEOSPATIAL, Property Listings, PLANNING ALERTS, BASIX and Microburbs, 2002 - 2031
Sources: ABS, GEOSPATIAL, Property Listings, PLANNING ALERTS, BASIX and Microburbs, 2002 - 2031
Gilead
29.0%
Gilead
29.0%
Sydney
33.9%
Sydney
33.9%
| Field | Value | VS Sydney | Trend | |
|---|---|---|---|---|
| 0 | Bottom 38% |
|
||
| 0.4 | Bottom 27% | Data for Jul 2023 | ||
| Premium | Premium | Premium | ||
| Premium | Premium | Premium | ||
| Premium | Premium | Premium | ||
| 4 | Bottom 13% | Data for Dec 2018 | ||
| 333 lots | Top 1% | Data for Apr 2022 | ||
| Premium | Premium | Premium | ||
| Premium | Premium | Premium | ||
| Premium | Premium | Premium | ||
| 1 | Top 44% |
|
Housing Stock Quality in Gilead
The higher the score, the higher the quality of the houses and units.
Sources: ABS, GEOSPATIAL, Property Listings, BASIX and Microburbs, 2006 - 2023
Sources: ABS, GEOSPATIAL, Property Listings, BASIX and Microburbs, 2006 - 2023
| Field | Value | VS Sydney | Trend | |
|---|---|---|---|---|
| 3.7% | Bottom 0% |
|
||
| 1.6 | Bottom 6% |
|
||
| 3.5% | Top 18% | Data for Jun 2023 | ||
| Premium | Premium | Premium |
Development Restrictions in Gilead

The higher the score, the more easily density can be increased.
Sources: GEOSPATIAL, ABS and Microburbs, 2011 - 2023
Sources: GEOSPATIAL, ABS and Microburbs, 2011 - 2023
Gilead
26.6%
Gilead
26.6%
Sydney
39.0%
Sydney
39.0%
| Field | Value | VS Sydney | Trend | |
|---|---|---|---|---|
| 0.5 sq km | Bottom 3% | Data for Jan 2021 | ||
| 0.65 | Bottom 48% | Data for Feb 2023 | ||
| 1.2% | Top 25% | Data for Jun 2023 | ||
| 11 | Top 15% | Data for Jun 2023 | ||
| 347 sqm per resident | Bottom 14% | Data for Jan 2021 |
Risk in Gilead

The higher the score, the more exposed households are to financial stress.
Sources: ABS, Property Listings and Microburbs, 2006 - 2023
Sources: ABS, Property Listings and Microburbs, 2006 - 2023
Gilead
41.5%
Gilead
41.5%
Sydney
64.0%
Sydney
64.0%
| Field | Value | VS Sydney | Trend | |
|---|---|---|---|---|
| 99.0% | Top 22% |
|
||
| 1.0% | Bottom 22% |
|
||
| 41 | Top 25% | Data for Jun 2023 | ||
| $1,400 | Bottom 24% |
|
||
| 79 | Top 47% | Data for Jun 2023 | ||
| 71 | Bottom 25% | Data for Jun 2023 | ||
| 15.0% | Bottom 22% |
|
||
| 3.9% | Bottom 2% |
|
Housing Demand in Gilead
The higher the score, the more demand their is for housing in the area, both current and future.
Sources: ABS, TORREN, Property Listings and Microburbs, 1975 - 2030
Sources: ABS, TORREN, Property Listings and Microburbs, 1975 - 2030
Gilead
80.7%
Gilead
80.7%
Sydney
87.0%
Sydney
87.0%
| Field | Value | VS Sydney | Trend | |
|---|---|---|---|---|
| 43300 | Top 1% |
|
||
| 186000 | Top 4% |
|
||
| Premium | Premium | Premium | ||
| 185000 | Top 6% |
|
||
| Premium | Premium | Premium | ||
| Premium | Premium | Premium |
Unit Market in Gilead
Sources: Property Listings and Microburbs, 2002 - 2023
| Field | Value | VS Sydney | Trend | |
|---|---|---|---|---|
| Premium | Premium | Premium | ||
| $493 | Top 44% |
|
||
| Premium | Premium | Premium | ||
| 65.4% | Bottom 30% |
|
Recently Sold Houses (33)
| Address | Price | Bedrooms | Bathrooms | Garage spaces | Date sold | Subdivisible into | Sale Type |
|---|---|---|---|---|---|---|---|
| 552 Appin Rd | Price Withheld | 6.0 | 3.0 | 8.0 | 06 Dec 2024 | 0 | On Market |
| Unit 2, 72 Glendower St | $866,000 | 3.0 | 2.0 | 25 Jul 2024 | 0 | On Market | |
| Unit 363, 72 Glendower St | Price Withheld | 3.0 | 2.0 | 04 Jun 2024 | 0 | On Market | |
| Unit 514, 72 Glendower St | $750,000 | 3.0 | 2.0 | 1.0 | 20 Nov 2023 | 0 | On Market |
| Unit 42, 72 Glendower St | $750,000 | 3.0 | 2.0 | 12 Oct 2023 | 0 | On Market |
Planning Applications: Dwellings (10)
| Headline | Place | Date |
|---|---|---|
| Construction of an attached single storey dual occupancy and Torrens title subdivision - Campbelltown City Council 904/2025/DA-RS | 29 Frampton Drive, Gilead NSW 2560 | 09 Mar 2025 |
| Construction of a two storey exhibition home with associated signage - Campbelltown City Council 827/2025/DA-DW | 26 Bunyip Avenue, Gilead NSW 2560 | 04 Mar 2025 |
| Use of premise for agricultural produced industry and construction of a farm building - Campbelltown City Council 289/2025/DA-U | 512 Appin Road, Gilead NSW 2560 | 07 Feb 2025 |
| Construction of a 2.7m high agricultural fence in the eastern and southern boundaries of the estate - Campbelltown City Council 1327/2024/DA-O | 901 Appin Road, Gilead NSW 2560 | 02 May 2024 |
| Modification to road layout and yield of units within Stage 4 Stage 1 - Construction of 840 serviced self-care dwellings, community facility building and associated infrastructure works and landscaping. Stage 2 - Construction of two hundred and seventy (270) hostel units in two buildings - Campbelltown City Council 2828/2005/DA-SL/L | 72 Glendower Street, Gilead NSW 2560 | 25 Oct 2023 |
Planning Applications: Other (5)
| Headline | Place | Date |
|---|---|---|
| Modification to amend the approved clubhouse ground floor entry and the internal office and reception area - Campbelltown City Council 2828/2005/DA-SL/J | 72 Glendower Street, Gilead NSW 2560 | 19 Sep 2022 |
| Modification to amend the NSW Rural Fire Service general terms of approval - Campbelltown City Council 2828/2005/DA-SL/I | 72 Glendower Street, Gilead NSW 2560 | 15 Aug 2022 |
| Amendment of certain conditions of development consent for an approved seniors living development - Campbelltown City Council 2828/2005/DA-SL/H | 72 Glendower Street, Gilead NSW 2560 | 01 Aug 2022 |
| Amendment of certain conditions of development consent for an approved seniors living development - Campbelltown City Council 2828/2005/DA-SL/G | 72 Glendower Street, Gilead NSW 2560 | 10 Mar 2022 |
| Modification to correct date of original determination of Development Application - Campbelltown City Council 2828/2005/DA-SL/E | 72 Glendower Street, Gilead NSW 2560 | 10 Aug 2021 |
LGA Details (1)
| Headline | Place | Datetime |
|---|---|---|
| Local government area | Campbelltown (NSW) |
Percent of Renters by Street (4)
| Percent of Renters | Street |
|---|---|
| 17.1% | Appin Rd |
| 4.4% | Glendower St |
| 100.0% | Medhurst Rd |
| 0.0% | Menangle Rd |
Turnover Rate by Street (2)
| Turnover rate | Street | Turnover Label | Turnover Years | Year |
|---|---|---|---|---|
| 14.9% | Glendower St | very tightly held | Every 67.3 years (very tightly held) | 2025 |
| 102.8% | Appin Rd | high turnover | Every 9.7 years (high turnover) | 2025 |
Median Unit Sale Prices by Street (6)
| Date | Median sale value | Street |
|---|---|---|
| 31 Jan 2025 | 756000.0 | Glendower St |
| 25 Apr 2024 | $3,248,000 | Appin Rd |
| 31 Jan 2025 | 756000.0 | Glendower St |
| 31 Jan 2025 | 756000.0 | Glendower St |
| 31 Jan 2025 | 756000.0 | Glendower St |
Median House Sale Prices by Street (35)
| Street | Date | Median sale value |
|---|---|---|
| Glendower St | 10 May 2024 | $775,000 |
| Appin Rd | 10 May 2024 | $3,248,000 |
| Glendower St | 31 May 2024 | 712900.0 |
| Glendower St | 30 Jun 2024 | 563850.0 |
| Glendower St | 30 Jun 2024 | 616050.0 |
Recent Rental Unit Listings (100)
| Address | Rent (per week) | Bedrooms | Bathrooms | Garage spaces | Date |
|---|---|---|---|---|---|
| Unit 5, 72 Glendower St | $580 | 3.0 | 2.0 | 1.0 | 26 Sep 2024 |
| Unit 5, 72 Glendower St | $580 | 3.0 | 2.0 | 1.0 | 26 Sep 2024 |
| Unit 5, 72 Glendower St | $580 | 3.0 | 2.0 | 1.0 | 26 Sep 2024 |
| Unit 5, 72 Glendower St | $580 | 3.0 | 2.0 | 1.0 | 26 Sep 2024 |
| Unit 5, 72 Glendower St | $580 | 3.0 | 2.0 | 1.0 | 26 Sep 2024 |
Recent Rental House Listings (100)
| Address | Rent (per week) | Bedrooms | Bathrooms | Garage spaces | Date | Subdivisible into |
|---|---|---|---|---|---|---|
| 534 Appin Rd | $600 | 3 | 1 | 1 | 26 Feb 2024 | 0 |
| 534 Appin Rd | $590 | 3 | 1 | 1 | 26 Feb 2024 | 0 |
| 534 Appin Rd | $600 | 3 | 1 | 1 | 26 Feb 2024 | 0 |
| 534 Appin Rd | $600 | 3 | 1 | 1 | 26 Feb 2024 | 0 |
| 534 Appin Rd | $590 | 3 | 1 | 1 | 26 Feb 2024 | 0 |
Recently Sold Units (100)
| Address | Price | Bedrooms | Bathrooms | Garage spaces | Date sold | Sale Type |
|---|---|---|---|---|---|---|
| 534 Appin Rd | Price Withheld | 3.0 | 1.0 | 07 Mar 2025 | On Market | |
| 715 Appin Rd | $2,050,000 | 0.0 | 04 Feb 2025 | On Market | ||
| 715 Appin Rd | $2,050,000 | 0.0 | 04 Feb 2025 | On Market | ||
| 715 Appin Rd | $2,050,000 | 0.0 | 04 Feb 2025 | On Market | ||
| 715 Appin Rd | $2,050,000 | 0.0 | 04 Feb 2025 | On Market |
Loading entities ..