.png)
Profiles
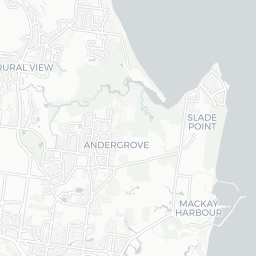
Nearby Suburbs
Real Estate Market: Is Habana QLD 4740 a Good Suburb to Buy Into?
Housing Market in Habana

Sources: Property Listings and Microburbs, 2002 - 2023
| Field | Value | VS Mackay | Trend | |
|---|---|---|---|---|
| Premium | Premium | Premium | ||
| Premium | Premium | Premium | ||
| Premium | Premium | Premium | ||
| $666 | Top 29% |
|
||
| Premium | Premium | Premium |
Housing Supply in Habana

The higher the supply score the more supply is on the market, both current and future.
Sources: ABS, GEOSPATIAL, Property Listings, PLANNING ALERTS and Microburbs, 2002 - 2023
Sources: ABS, GEOSPATIAL, Property Listings, PLANNING ALERTS and Microburbs, 2002 - 2023
Habana
31.6%
Habana
31.6%
Mackay
40.0%
Mackay
40.0%
| Field | Value | VS Mackay | Trend | |
|---|---|---|---|---|
| 325 | Top 12% |
|
||
| 0.4 | Bottom 27% | Data for Jul 2023 | ||
| 15.8 | Top 24% | Data for May 2023 | ||
| Premium | Premium | Premium | ||
| Premium | Premium | Premium | ||
| Premium | Premium | Premium | ||
| Premium | Premium | Premium | ||
| Premium | Premium | Premium | ||
| 1 | Top 44% |
|
Housing Stock Quality in Habana
The higher the score, the higher the quality of the houses and units.
Sources: ABS, GEOSPATIAL, Property Listings and Microburbs, 2006 - 2023
Sources: ABS, GEOSPATIAL, Property Listings and Microburbs, 2006 - 2023
| Field | Value | VS Mackay | Trend | |
|---|---|---|---|---|
| 100.0% | Top 31% |
|
||
| 2.9 | Top 17% |
|
||
| 0.0% | Bottom 37% | Data for Jun 2023 |
Development Restrictions in Habana

The higher the score, the more easily density can be increased.
Sources: GEOSPATIAL, TORREN, ABS and Microburbs, 2011 - 2023
Sources: GEOSPATIAL, TORREN, ABS and Microburbs, 2011 - 2023
Habana
32.9%
Habana
32.9%
Mackay
36.8%
Mackay
36.8%
| Field | Value | VS Mackay | Trend | |
|---|---|---|---|---|
| 64.0 sq km | Top 18% | Data for Jan 2021 | ||
| 0.0 sq km | Top 8% | Data for Jun 2023 | ||
| 3960 sqm per resident | Top 29% | Data for Jan 2021 |
Risk in Habana

The higher the score, the more exposed households are to financial stress.
Sources: ABS, Property Listings, TORREN and Microburbs, 2006 - 2023
Sources: ABS, Property Listings, TORREN and Microburbs, 2006 - 2023
Habana
41.8
Habana
41.8
Mackay
40.1
Mackay
40.1
| Field | Value | VS Mackay | Trend | |
|---|---|---|---|---|
| 98.1% | Top 24% | 0 to May 2023 | ||
| 1.9% | Bottom 24% |
|
||
| 25 | Bottom 23% | Data for Jun 2023 | ||
| $2,500 | Top 23% |
|
||
| 83 | Top 19% | Data for Jun 2023 | ||
| 77 | Top 41% | Data for Jun 2023 | ||
| 18.6% | Bottom 31% |
|
||
| 57.8% | Top 10% |
|
Housing Demand in Habana
The higher the score, the more demand their is for housing in the area, both current and future.
Sources: ABS, TORREN, Property Listings and Microburbs, 2006 - 2030
Sources: ABS, TORREN, Property Listings and Microburbs, 2006 - 2030
Habana
61.8%
Habana
61.8%
Mackay
61.4%
Mackay
61.4%
| Field | Value | VS Mackay | Trend | |
|---|---|---|---|---|
| Premium | Premium | Premium | ||
| 9870 | Top 47% |
|
||
| 127000 | Top 17% |
|
||
| Premium | Premium | Premium | ||
| 122000 | Top 14% |
|
||
| Premium | Premium | Premium | ||
| Premium | Premium | Premium | ||
| Premium | Premium | Premium |
Unit Market in Habana
Sources: Property Listings and Microburbs, 2002 - 2023
| Field | Value | VS Mackay | Trend | |
|---|---|---|---|---|
| Premium | Premium | Premium | ||
| $524 | Top 40% |
|
||
| Premium | Premium | Premium | ||
| 82.8% | Top 24% |
|
LGA Details (1)
| Headline | Place | Datetime |
|---|---|---|
| Local government area | Mackay |
Percent of Renters by Street (33)
| Percent of Renters | Street |
|---|---|
| 0.0% | Carranya Rd |
| 12.0% | Attards Rd |
| 0.0% | Balluts Rd |
| 0.0% | Barcoo Rd |
| 23.3% | Barrow Hill Rd |
Turnover Rate by Street (30)
| Turnover rate | Street | Turnover Label | Turnover Years | Year |
|---|---|---|---|---|
| 77.1% | Gardiners Rd | average turnover | Every 13.0 years (average turnover) | 2025 |
| 133.3% | Carranya Rd | very high turnover | Every 7.5 years (very high turnover) | 2025 |
| 125.0% | Attards Rd | very high turnover | Every 8.0 years (very high turnover) | 2025 |
| 125.0% | Friedmans Rd | very high turnover | Every 8.0 years (very high turnover) | 2025 |
| 71.4% | Summerhill Rise | average turnover | Every 14.0 years (average turnover) | 2025 |
Median Unit Sale Prices by Street (3)
| Date | Median sale value | Street |
|---|---|---|
| 10 May 2024 | $975,000 | Mdina Dr |
| 10 May 2024 | $524,500 | Attards Rd |
| 25 Apr 2024 | $1,105,000 | Olletts Rd |
Planning Applications: Dwellings (18)
| Headline | Place | Date |
|---|---|---|
| Material Change of Use - Development Permit for Dwelling House (1a and Patio Class 10a) (Bushfire Hazard Overlay) - Mackay Regional Council DA-2025-21 | 175 Barrow Hill Road Habana QLD 4740 | 15 Feb 2025 |
| Material Change of Use - Development Permit for Dwelling House (Class 1a) (Bushfire Hazard Overlay and Landslide Hazard Overlay) - Mackay Regional Council DA-2024-193 | 45 Mezin Road Habana QLD 4740 | 16 Nov 2024 |
| Material Change of Use - Development Permit for Dwelling House (Class 1a)(Bushfire Hazard Overlay / Landslide Hazard Overlay) - Mackay Regional Council DA-2024-193 | 45 Mezin Road Habana QLD 4740 | 16 Nov 2024 |
| Material Change of Use - Development Permit for Dwelling House (Shed - Class 10a) - Mackay Regional Council DA-2024-118 | L 22 Yakapari-Habana Road Habana QLD 4740 | 29 Jul 2024 |
| Material Change of Use - Development Permit for Dwelling House (Shed with Awning - Class 10a) - Mackay Regional Council DA-2024-115 | 171 Gardiners Road Habana QLD 4740 | 18 Jul 2024 |
Planning Applications: Other (10)
| Headline | Place | Date |
|---|---|---|
| Boundary Realignment - 2 Rural Lots into 2 Lots - Mackay Regional Council DA-2024-179 | 340 Sivyers Road Habana QLD 4740 | 26 Oct 2024 |
| Reconfiguring a Lot - Development Permit for Boundary Realignment (2 Lots into 2 Lots) - Mackay Regional Council DA-2024-144 | 988 Yakapari-Habana Road Habana QLD 4740 | 12 Sep 2024 |
| Material Change of Use - Development Permit for Nature Based Tourism - Mackay Regional Council DA-2024-139 | 79 Kurkowskis Road Habana QLD 4740 | 05 Sep 2024 |
| Reconfiguring a Lot - Development Permit for Boundary Realignment (2 into 2 Lots) - Mackay Regional Council DA-2023-158 | 83 Kurkowskis Road Habana QLD 4740 | 25 Aug 2023 |
| Material Change of Use - Development Permit for Shop and Ancillary Food and Drink Outlet - Mackay Regional Council DA-2023-112 | 6 Shady Lane Habana QLD 4740 | 21 Jun 2023 |
Recently Sold Houses (100)
| Address | Price | Bedrooms | Bathrooms | Garage spaces | Date sold | Subdivisible into | Sale Type |
|---|---|---|---|---|---|---|---|
| 159 Gardiners Rd | $950,000 | 4.0 | 3.0 | 0.0 | 05 Feb 2025 | 0 | On Market |
| 108 Le Gardes Rd | $620,000 | 3.0 | 1.0 | 0.0 | 18 Dec 2024 | 0 | On Market |
| 195 Barrow Hill Rd | $1,360,000 | 7.0 | 3.0 | 5.0 | 01 Nov 2024 | 0 | On Market |
| 101 Attards Rd | $490,000 | 0.0 | 0.0 | 0.0 | 15 Jul 2024 | 0 | On Market |
| 8 Galea Ct | $775,000 | 3.0 | 1.0 | 4.0 | 15 Jul 2024 | 0 | On Market |
Businesses (8)
| Name | Address |
|---|---|
| Olivers Way Bobcats | 109 Barrow Hill Rd, Habana QLD 4740, Australia |
| Aqua Drilling | 536 Yakapari Habana Rd, Habana QLD 4740, Australia |
| Backyard Bores & Geotech Drilling | 536 Yakapari Habana Rd, Habana QLD 4740, Australia |
| NV Builders Pty Ltd | 951, Mackay Habana Rd |
| NV Builders Pty Ltd | 951, Mackay Habana Rd |
Median House Sale Prices by Street (100)
| Street | Date | Median sale value |
|---|---|---|
| Habana Woods Ct | 06 Oct 2023 | $751,600 |
| Olletts Rd | 10 May 2024 | $1,100,000 |
| Mackay-Habana Rd | 10 May 2024 | $412,500 |
| Attards Rd | 10 May 2024 | $1,150,000 |
| Bobongies Rd | 06 Oct 2023 | $1,014,000 |
Recent Rental House Listings (100)
| Address | Rent (per week) | Bedrooms | Bathrooms | Garage spaces | Date | Subdivisible into |
|---|---|---|---|---|---|---|
| 208 Bobongies Rd | $430 | 2 | 1 | 1 | 17 Jan 2025 | 0 |
| 152 Barrow Hill Rd | $980 | 4 | 2 | 4 | 15 Jul 2024 | 0 |
| 152 Barrow Hill Rd | $980 | 4 | 2 | 4 | 15 Jul 2024 | 0 |
| 152 Barrow Hill Rd | $980 | 4 | 2 | 4 | 15 Jul 2024 | 0 |
| 152 Barrow Hill Rd | $980 | 4 | 2 | 4 | 15 Jul 2024 | 0 |
Recent Rental Unit Listings (100)
| Address | Rent (per week) | Bedrooms | Bathrooms | Garage spaces | Date |
|---|---|---|---|---|---|
| 108 Olletts Rd | $700 | 4.0 | 2.0 | 2.0 | 07 Jun 2023 |
| 108 Olletts Rd | $700 | 4.0 | 2.0 | 2.0 | 07 Jun 2023 |
| 108 Olletts Rd | $700 | 4.0 | 2.0 | 2.0 | 07 Jun 2023 |
| 108 Olletts Rd | $700 | 4.0 | 2.0 | 2.0 | 07 Jun 2023 |
| 108 Olletts Rd | $700 | 4.0 | 2.0 | 2.0 | 07 Jun 2023 |
Recently Sold Units (100)
| Address | Price | Bedrooms | Bathrooms | Garage spaces | Date sold | Sale Type |
|---|---|---|---|---|---|---|
| 54 Sants Rd | Price Withheld | 4.0 | 2.0 | 2.0 | 12 Dec 2024 | On Market |
| 54 Sants Rd | Price Withheld | 4.0 | 2.0 | 2.0 | 12 Dec 2024 | On Market |
| 54 Sants Rd | Price Withheld | 4.0 | 2.0 | 2.0 | 12 Dec 2024 | On Market |
| 54 Sants Rd | Price Withheld | 4.0 | 2.0 | 2.0 | 12 Dec 2024 | On Market |
| 54 Sants Rd | Price Withheld | 4.0 | 2.0 | 2.0 | 12 Dec 2024 | On Market |
Loading entities ..