.png)
Profiles
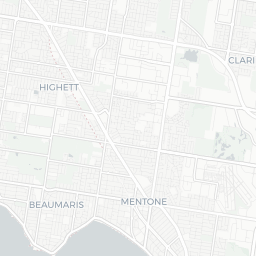
Nearby Suburbs
Real Estate Market: Is Hampton East VIC 3188 a Good Suburb to Buy Into?
Housing Market in Hampton East

Sources: Property Listings and Microburbs, 2002 - 2023
| Field | Value | VS Melbourne | Trend | |
|---|---|---|---|---|
| Premium | Premium | Premium | ||
| Premium | Premium | Premium | ||
| Premium | Premium | Premium | ||
| $807 | Top 12% |
|
||
| Premium | Premium | Premium |
Housing Supply in Hampton East

The higher the supply score the more supply is on the market, both current and future.
Sources: ABS, GEOSPATIAL, Property Listings, PLANNING ALERTS and Microburbs, 2002 - 2023
Sources: ABS, GEOSPATIAL, Property Listings, PLANNING ALERTS and Microburbs, 2002 - 2023
Hampton East
24.5%
Hampton East
24.5%
Melbourne
28.8%
Melbourne
28.8%
| Field | Value | VS Melbourne | Trend | |
|---|---|---|---|---|
| 212 | Top 14% |
|
||
| 2.0 | Bottom 44% | Data for Jul 2023 | ||
| 90.9 | Top 2% | Data for May 2023 | ||
| Premium | Premium | Premium | ||
| Premium | Premium | Premium | ||
| Premium | Premium | Premium | ||
| 4 lots | Top 48% |
|
||
| Premium | Premium | Premium | ||
| Premium | Premium | Premium | ||
| 23 | Top 6% |
|
Housing Stock Quality in Hampton East
The higher the score, the higher the quality of the houses and units.
Sources: ABS, GEOSPATIAL, Property Listings and Microburbs, 2006 - 2023
Sources: ABS, GEOSPATIAL, Property Listings and Microburbs, 2006 - 2023
| Field | Value | VS Melbourne | Trend | |
|---|---|---|---|---|
| 57.1% | Bottom 5% |
|
||
| 2.4 | Bottom 42% |
|
||
| 0.0% | Bottom 37% | Data for Jun 2023 |
Development Restrictions in Hampton East

The higher the score, the more easily density can be increased.
Sources: GEOSPATIAL, ABS and Microburbs, 2011 - 2023
Sources: GEOSPATIAL, ABS and Microburbs, 2011 - 2023
Hampton East
45.9%
Hampton East
45.9%
Melbourne
36.9%
Melbourne
36.9%
| Field | Value | VS Melbourne | Trend | |
|---|---|---|---|---|
| 1.5 sq km | Bottom 15% |
|
||
| 0.0 sq km | Bottom 41% | Data for Jun 2023 | ||
| 267 sqm per resident | Bottom 7% |
|
Risk in Hampton East

The higher the score, the more exposed households are to financial stress.
Sources: ABS, Property Listings and Microburbs, 2006 - 2023
Sources: ABS, Property Listings and Microburbs, 2006 - 2023
Hampton East
66.0%
Hampton East
66.0%
Melbourne
60.4%
Melbourne
60.4%
| Field | Value | VS Melbourne | Trend | |
|---|---|---|---|---|
| 81.1% | Bottom 18% | Data for May 2023 | ||
| 18.9% | Top 18% | Data for May 2023 | ||
| 44 | Top 21% | Data for Jun 2023 | ||
| $2,760 | Top 15% |
|
||
| 81 | Top 36% | Data for Jun 2023 | ||
| 80 | Top 22% | Data for Jun 2023 | ||
| 30.6% | Top 14% |
|
||
| 39.2% | Top 47% |
|
Housing Demand in Hampton East
The higher the score, the more demand their is for housing in the area, both current and future.
Sources: ABS, TORREN, Property Listings and Microburbs, 1975 - 2030
Sources: ABS, TORREN, Property Listings and Microburbs, 1975 - 2030
Hampton East
79.8%
Hampton East
79.8%
Melbourne
82.9%
Melbourne
82.9%
| Field | Value | VS Melbourne | Trend | |
|---|---|---|---|---|
| 21500 | Top 16% |
|
||
| 104000 | Top 25% |
|
||
| Premium | Premium | Premium | ||
| 104000 | Top 15% |
|
||
| Premium | Premium | Premium | ||
| Premium | Premium | Premium | ||
| Premium | Premium | Premium |
Unit Market in Hampton East
Sources: Property Listings and Microburbs, 2002 - 2023
| Field | Value | VS Melbourne | Trend | |
|---|---|---|---|---|
| Premium | Premium | Premium | ||
| $617 | Top 19% |
|
||
| Premium | Premium | Premium | ||
| 45.6% | Bottom 9% |
|
LGA Details (1)
| Headline | Place | Datetime |
|---|---|---|
| Local government area | Bayside (Vic.) |
Median House Rental Prices by Street (24)
| Level_0 | Street | Date | Median rent (per week) |
|---|---|---|---|
| 109269 | Exley Rd | 30 Mar 2025 | $1,125 |
| 109193 | Dane Rd | 30 Mar 2025 | $775 |
| 109451 | Kelly Ave | 30 Mar 2025 | $1,200 |
| 109448 | Keiller St | 30 Mar 2025 | $670 |
| 109445 | Katoomba St | 30 Mar 2025 | $650 |
Realtors (3)
| Headline | Place | Datetime |
|---|---|---|
| Certain Wealth Group Pty Ltd | Unit 4 844 Nepean Hwy | |
| Melbourne Body Corporate Management Moorabbin | Level 1 896 Nepean Hwy | |
| Starrywell |
Median Unit Sale Prices by Street (100)
| Date | Median sale value | Street |
|---|---|---|
| 10 May 2024 | $575,000 | Keiller St |
| 10 May 2024 | $812,500 | Kelly Ave |
| 10 May 2024 | $485,000 | Nepean Ave |
| 10 May 2024 | $625,000 | Bluff Rd |
| 10 May 2024 | $780,000 | Guernsey Ave |
Percent of Renters by Street (66)
| Percent of Renters | Street |
|---|---|
| 38.2% | Bartlett St |
| 12.8% | Acheron Ct |
| 25.8% | Apex Ave |
| 65.2% | Carrington St |
| 4.3% | Bluff Rd |
Turnover Rate by Street (64)
| Turnover rate | Street | Turnover Label | Turnover Years | Year |
|---|---|---|---|---|
| 87.5% | Nepean Ave | high turnover | Every 11.4 years (high turnover) | 2025 |
| 113.1% | Charming St | very high turnover | Every 8.8 years (very high turnover) | 2025 |
| 85.2% | Bartlett St | average turnover | Every 11.7 years (average turnover) | 2025 |
| 77.0% | Bluff Rd | average turnover | Every 13.0 years (average turnover) | 2025 |
| 91.3% | Kelly Ave | high turnover | Every 11.0 years (high turnover) | 2025 |
Median House Sale Prices by Street (100)
| Street | Date | Median sale value |
|---|---|---|
| Wickham Rd | 10 May 2024 | $1,265,000 |
| Widdop Cr | 10 May 2024 | $1,275,000 |
| Tarwin Ave | 10 May 2024 | $1,775,000 |
| Stonehaven Cr | 10 May 2024 | $1,312,000 |
| Spring Rd | 10 May 2024 | $1,460,000 |
Businesses (27)
| Name | Address |
|---|---|
| South.Rd | 348 South Rd, Hampton East VIC 3188, Australia |
| DPK Building | 3 Warland Rd, Hampton East VIC 3188, Australia |
| Bayside Excavation | 4 Nepean Ave, Hampton East VIC 3188, Australia |
| Avenue Demolitions | 15 Daff Ave, Hampton East VIC 3188, Australia |
| Hydebuild Pty Ltd | 414 Bluff Rd, Hampton East VIC 3188, Australia |
Planning Applications: Dwellings (77)
| Headline | Place | Date |
|---|---|---|
| Proposed construction of two single storey dwellings - Bayside City Council (Victoria) 382/2024 | 21 Stonehaven Crescent Hampton East VIC 3188 | 21 Sep 2024 |
| 2 New Dwellings Demolition of existing single storey dwelling. Construction of two double storey townhouses (dual occupancy) side by side - Bayside City Council (Victoria) 376/2024 | 25 Leonard Street Hampton East VIC 3188 | 17 Sep 2024 |
| 2 New Dwellings 2 New Dwellings - Bayside City Council (Victoria) 356/2024 | 12 Saltair Street Hampton East VIC 3188 | 05 Sep 2024 |
| Construct two double-storey dwellings at 118 Wickham Road, Hampton Eas t (the subject site). - Bayside City Council (Victoria) 320/2024 | 118 Wickham Road Hampton East VIC 3188 | 14 Aug 2024 |
| Double Storey Dual Occupancy in NRZ3 2 New Dwellings - Bayside City Council (Victoria) 295/2024 | 284 South Road Hampton East VIC 3188 | 26 Jul 2024 |
Planning Applications: Other (23)
| Headline | Place | Date |
|---|---|---|
| First floor addition to land with common property 6m above GL - Bayside City Council (Victoria) 371/2024 | Unit 2 14 Flowerdale Road Hampton East VIC 3188 | 13 Sep 2024 |
| To erect buildings and works to extend the existing building in a Comm ercial 1 Zone, Heritage Overlay HO98, Design and Development Overlay S chedule 11 and Development Contributions Plan Overlay Schedule 1 and a reduction of car parking in accordance with the submitted plans and r eport - Bayside City Council (Victoria) 355/2024 | 12 Saltair Street Hampton East VIC 3188 | 04 Sep 2024 |
| Office - Alts/Adds to Building Only and Carparking and Signs Office - Alts/Adds to Building Only Carparking Signs - Bayside City Council (Victoria) 433/2023 | 352 South Road Hampton East VIC 3188 | 20 Oct 2023 |
| Carport on a Lot < 500m2 Carport on a Lot < 500m2 - Bayside City Council (Victoria) 363/2023 | Unit 2 9 Dane Road Hampton East VIC 3188 | 09 Sep 2023 |
| 2 New Dwellings Adding a carport to the existing single storey dwelling and the construction of a double storey dwelling at the rear of the site - Bayside City Council (Victoria) 66/2003 | Unit 1 25 Wickham Road Hampton East VIC 3188 | 27 Apr 2023 |
Recently Sold Houses (100)
| Address | Price | Bedrooms | Bathrooms | Garage spaces | Date sold | Subdivisible into | Sale Type |
|---|---|---|---|---|---|---|---|
| 20a Wickham Rd | Price Withheld | 3.0 | 1.0 | 3.0 | 25 Mar 2025 | 0 | On Market |
| 24 Daff Ave | Price Withheld | 4.0 | 2.0 | 2.0 | 05 Mar 2025 | 0 | On Market |
| 3 Little Ave | $1,315,000 | 2.0 | 1.0 | 2.0 | 22 Feb 2025 | 0 | On Market |
| 4 Roydon St | Price Withheld | 4.0 | 2.0 | 2.0 | 19 Feb 2025 | 0 | On Market |
| 3 Nepean Ave | $1,450,000 | 3.0 | 2.0 | 2.0 | 13 Feb 2025 | 0 | On Market |
Recent Rental Unit Listings (100)
| Address | Rent (per week) | Bedrooms | Bathrooms | Garage spaces | Date |
|---|---|---|---|---|---|
| Unit 8, 30 Nepean Ave | $420 | 1.0 | 1.0 | 1.0 | 14 Mar 2025 |
| Unit 8, 30 Nepean Ave | $420 | 1.0 | 1.0 | 1.0 | 14 Mar 2025 |
| Unit 8, 30 Nepean Ave | $420 | 1.0 | 1.0 | 1.0 | 14 Mar 2025 |
| Unit 8, 30 Nepean Ave | $420 | 1.0 | 1.0 | 1.0 | 14 Mar 2025 |
| Unit 20, 21 Roydon St | $495 | 2.0 | 1.0 | 1.0 | 05 Mar 2025 |
Recently Sold Units (100)
| Address | Price | Bedrooms | Bathrooms | Garage spaces | Date sold | Sale Type |
|---|---|---|---|---|---|---|
| 14a Carrington St | Price Withheld | 3.0 | 2.0 | 3.0 | 27 Mar 2025 | On Market |
| 14a Carrington St | Price Withheld | 3.0 | 2.0 | 3.0 | 27 Mar 2025 | On Market |
| Unit 2, 16 Evans Ave | $1,315,000 | 3.0 | 2.0 | 2.0 | 22 Mar 2025 | On Market |
| Unit 2, 16 Evans Ave | $1,315,000 | 3.0 | 2.0 | 2.0 | 22 Mar 2025 | On Market |
| Unit 2, 16 Evans Ave | $1,315,000 | 3.0 | 2.0 | 2.0 | 22 Mar 2025 | On Market |
Recent Rental House Listings (100)
| Address | Rent (per week) | Bedrooms | Bathrooms | Garage spaces | Date | Subdivisible into |
|---|---|---|---|---|---|---|
| Unit 3, 34 Nepean Ave | $600 | 3 | 2 | 2 | 28 Mar 2025 | 0 |
| Unit 3, 34 Nepean Ave | $600 | 3 | 2 | 2 | 28 Mar 2025 | 0 |
| Unit 1, 2 King St | $750 | 2 | 1 | 2 | 28 Mar 2025 | 0 |
| Unit 1, 2 King St | $750 | 2 | 1 | 2 | 28 Mar 2025 | 0 |
| 21 Henrietta St | $920 | 4 | 2 | 2 | 27 Mar 2025 | 0 |
Loading entities ..