.png)
Profiles
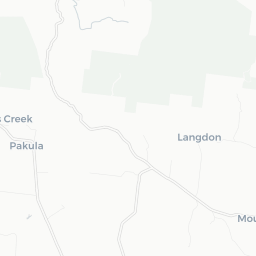
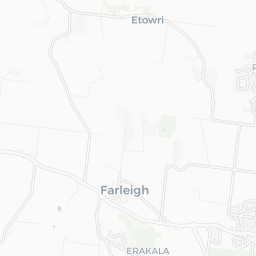
Nearby Suburbs
Real Estate Market: Is Kuttabul QLD 4741 a Good Suburb to Buy Into?
Housing Market in Kuttabul

Sources: Property Listings and Microburbs, 2002 - 2023
| Field | Value | VS Mackay | Trend | |
|---|---|---|---|---|
| Premium | Premium | Premium | ||
| Premium | Premium | Premium | ||
| Premium | Premium | Premium | ||
| $672 | Top 30% |
|
||
| Premium | Premium | Premium |
Housing Supply in Kuttabul

The higher the supply score the more supply is on the market, both current and future.
Sources: ABS, GEOSPATIAL, Property Listings, PLANNING ALERTS and Microburbs, 2002 - 2023
Sources: ABS, GEOSPATIAL, Property Listings, PLANNING ALERTS and Microburbs, 2002 - 2023
Kuttabul
31.1%
Kuttabul
31.1%
Mackay
40.0%
Mackay
40.0%
| Field | Value | VS Mackay | Trend | |
|---|---|---|---|---|
| 0 | Bottom 38% |
|
||
| 0.6 | Bottom 29% | Data for Jul 2023 | ||
| Premium | Premium | Premium | ||
| Premium | Premium | Premium | ||
| Premium | Premium | Premium | ||
| Premium | Premium | Premium | ||
| Premium | Premium | Premium | ||
| 1 | Top 43% | Data for Apr 2025 |
Housing Stock Quality in Kuttabul
The higher the score, the higher the quality of the houses and units.
Sources: ABS, GEOSPATIAL, Property Listings and Microburbs, 2006 - 2023
Sources: ABS, GEOSPATIAL, Property Listings and Microburbs, 2006 - 2023
| Field | Value | VS Mackay | Trend | |
|---|---|---|---|---|
| 96.3% | Bottom 30% |
|
||
| 2.7 | Top 30% |
|
||
| 0.0% | Bottom 37% | Data for Jun 2023 |
Development Restrictions in Kuttabul

The higher the score, the more easily density can be increased.
Sources: GEOSPATIAL, TORREN, ABS and Microburbs, 2011 - 2023
Sources: GEOSPATIAL, TORREN, ABS and Microburbs, 2011 - 2023
Kuttabul
33.2%
Kuttabul
33.2%
Mackay
36.8%
Mackay
36.8%
| Field | Value | VS Mackay | Trend | |
|---|---|---|---|---|
| 82.0 sq km | Top 14% | Data for Jan 2021 | ||
| 0.0 sq km | Bottom 39% | Data for Jun 2023 | ||
| 11400 sqm per resident | Top 15% | Data for Jan 2021 |
Risk in Kuttabul

The higher the score, the more exposed households are to financial stress.
Sources: ABS, Property Listings, TORREN and Microburbs, 2006 - 2023
Sources: ABS, Property Listings, TORREN and Microburbs, 2006 - 2023
Kuttabul
41.8
Kuttabul
41.8
Mackay
40.1
Mackay
40.1
| Field | Value | VS Mackay | Trend | |
|---|---|---|---|---|
| 98.8% | Top 23% | Data for May 2023 | ||
| 1.2% | Bottom 23% | Data for May 2023 | ||
| 23 | Bottom 17% | Data for Jun 2023 | ||
| $1,880 | Bottom 47% |
|
||
| 81 | Top 33% | Data for Jun 2023 | ||
| 76 | Bottom 49% | Data for Jun 2023 | ||
| 21.7% | Bottom 47% |
|
||
| 51.6% | Top 19% |
|
Housing Demand in Kuttabul
The higher the score, the more demand their is for housing in the area, both current and future.
Sources: ABS, TORREN, Property Listings and Microburbs, 2006 - 2030
Sources: ABS, TORREN, Property Listings and Microburbs, 2006 - 2030
Kuttabul
55.5%
Kuttabul
55.5%
Mackay
61.4%
Mackay
61.4%
| Field | Value | VS Mackay | Trend | |
|---|---|---|---|---|
| Premium | Premium | Premium | ||
| 9870 | Top 47% |
|
||
| 127000 | Top 17% |
|
||
| Premium | Premium | Premium | ||
| 122000 | Top 14% |
|
||
| Premium | Premium | Premium | ||
| Premium | Premium | Premium | ||
| Premium | Premium | Premium |
Unit Market in Kuttabul
Sources: Property Listings and Microburbs, 2002 - 2023
| Field | Value | VS Mackay | Trend | |
|---|---|---|---|---|
| Premium | Premium | Premium | ||
| $551 | Top 44% |
|
||
| Premium | Premium | Premium | ||
| 84.9% | Top 20% |
|
Accommodation Options (4)
| Headline | Place | Datetime |
|---|---|---|
| Kuttabul Hotel | 4741 Bruce Hwy | |
| The Feathered Nest Luxury Wildlife Retreat | 125 Royston Park Dr | |
LGA Details (1)
| Headline | Place | Datetime |
|---|---|---|
| Local government area | Mackay |
Planning Applications: Dwellings (3)
| Headline | Place | Date |
|---|---|---|
| Material Change of Use - Development Permit for Dwelling (Shed - Class 10a) - Mackay Regional Council DA-2025-11 | 29 Mount Martin Road Kuttabul QLD 4741 | 01 Feb 2025 |
| Material Change of Use - Development Permit for Dwelling House (Dwelling and Detached Extension - Class 1a) - Mackay Regional Council DA-2024-92 | L 22 Kuttabul Mount Jukes Road Kuttabul QLD 4741 | 17 Jun 2024 |
| Material Change of Use - Development Permit for Dwelling House (Bushfire Hazard & Extractive Resources and High Impact Activities Overlays) - Mackay Regional Council DA-2023-208 | L 52 Geeberga Station Road Kuttabul QLD 4741 | 02 Nov 2023 |
Planning Applications: Other (4)
| Headline | Place | Date |
|---|---|---|
| Tradeable Development Rights Boundary Realignment – 3 Lots into 3 Lots - Mackay Regional Council DA-2022-7 | 77 Mount Martin Road Kuttabul QLD 4741 | 20 Jan 2022 |
| Boundary Realignment - 3 Rural Lots into 3 Lots - Mackay Regional Council DA-2021-21 | 302 Geeberga Buthurra Road Kuttabul QLD 4741 | 05 May 2021 |
| Boundary Realignment - 3 Rural Lots into 3 Lots - Mackay Regional Council ROLC-21/2021 | 294 Geeberga Buthurra Road Kuttabul QLD 4741 | 02 Mar 2021 |
| Reconfiguration of a Lot - Boundary Realignment (2 Rural Lots into 2 Lots) - Mackay Regional Council ROLC-89/2020 | 406 Yakapari-Seaforth Road Kuttabul QLD 4741 | 24 Jun 2020 |
Percent of Renters by Street (34)
| Percent of Renters | Street |
|---|---|
| 0.0% | Brooks Rd |
| 0.0% | Brangus Ct |
| 0.0% | Beallah Rd |
| 52.8% | Bruce Hwy |
| 0.0% | Deals Rd |
Turnover Rate by Street (23)
| Turnover rate | Street | Turnover Label | Turnover Years | Year |
|---|---|---|---|---|
| 20.0% | Narpi Rd | very tightly held | Every 50.0 years (very tightly held) | 2025 |
| 55.6% | Mcgills Rd | quite tightly held | Every 18.0 years (quite tightly held) | 2025 |
| 66.7% | Watts Rd | quite tightly held | Every 15.0 years (quite tightly held) | 2025 |
| 200.0% | Mckays Rd | very high turnover | Every 5.0 years (very high turnover) | 2025 |
| 59.3% | Bruce Hwy | quite tightly held | Every 16.9 years (quite tightly held) | 2025 |
Businesses (3)
| Name | Address |
|---|---|
| Central Queensland Roofing | |
| Platypus Timbers | 393, Kuttabul-Mt Jukes Rd |
| Central Queensland Roofing |
Recently Sold Houses (81)
| Address | Price | Bedrooms | Bathrooms | Garage spaces | Date sold | Subdivisible into | Sale Type |
|---|---|---|---|---|---|---|---|
| 418 Kuttabul Mount Jukes Rd | $675,000 | 1.0 | 1.0 | 0.0 | 28 Mar 2025 | 0 | On Market |
| 248 Rutlands Rd | $445,000 | 0.0 | 0.0 | 07 Mar 2025 | 0 | On Market | |
| 206 Rutlands Rd | $785,000 | 1.0 | 4.0 | 24 Oct 2024 | 0 | On Market | |
| 206 Rutlands Rd | $785,000 | 3.0 | 1.0 | 4.0 | 24 Oct 2024 | 0 | On Market |
| 206 Rutlands Rd | Price Withheld | 1.0 | 4.0 | 24 Oct 2024 | 0 | On Market |
Median House Sale Prices by Street (100)
| Street | Date | Median sale value |
|---|---|---|
| Geeberga Buthurra Rd | 10 May 2024 | $678,600 |
| Brangus Ct | 06 Oct 2023 | $548,000 |
| Yakapari - Seaforth Rd | 06 Oct 2023 | $792,200 |
| Pernas Rd | 06 Oct 2023 | $1,180,000 |
| Kuttabul Mount Jukes Rd | 06 Oct 2023 | $360,100 |
Recent Rental House Listings (100)
| Address | Rent (per week) | Bedrooms | Bathrooms | Garage spaces | Date | Subdivisible into |
|---|---|---|---|---|---|---|
| 3197 Bruce Hwy | Price Withheld | 2 | 1 | 2 | 07 Jun 2023 | 0 |
| 3197 Bruce Hwy | Price Withheld | 2 | 1 | 2 | 07 Jun 2023 | 0 |
| 3197 Bruce Hwy | Price Withheld | 2 | 1 | 2 | 07 Jun 2023 | 0 |
| 3197 Bruce Hwy | Price Withheld | 2 | 1 | 2 | 07 Jun 2023 | 0 |
| 3197 Bruce Hwy | Price Withheld | 2 | 1 | 2 | 07 Jun 2023 | 0 |
Recent Rental Unit Listings (1)
| Address | Rent (per week) | Bedrooms | Bathrooms | Garage spaces | Date |
|---|---|---|---|---|---|
| 1/77 Mount Martin Rd | $290 | Unknown | Unknown | Unknown | 23 Jul 2015 |
Recently Sold Units (100)
| Address | Price | Bedrooms | Bathrooms | Garage spaces | Date sold | Sale Type |
|---|---|---|---|---|---|---|
| 67 Royston Park Dr | $685,000 | 3.0 | 1.0 | 5.0 | 18 Oct 2024 | On Market |
| 67 Royston Park Dr | $685,000 | 3.0 | 1.0 | 5.0 | 18 Oct 2024 | On Market |
| 67 Royston Park Dr | $685,000 | 3.0 | 1.0 | 5.0 | 18 Oct 2024 | On Market |
| 67 Royston Park Dr | $685,000 | 3.0 | 1.0 | 5.0 | 18 Oct 2024 | On Market |
| 67 Royston Park Dr | $685,000 | 3.0 | 1.0 | 5.0 | 18 Oct 2024 | On Market |
Loading entities ..