.png)
Profiles
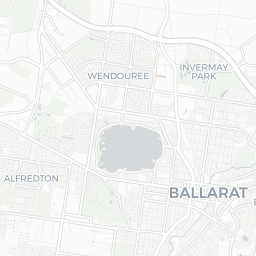
Nearby Suburbs
Real Estate Market: Is Lake Wendouree VIC 3350 a Good Suburb to Buy Into?
Housing Market in Lake Wendouree

Sources: Property Listings and Microburbs, 2002 - 2023
| Field | Value | VS Ballarat | Trend | |
|---|---|---|---|---|
| Premium | Premium | Premium | ||
| Premium | Premium | Premium | ||
| Premium | Premium | Premium | ||
| $447 | Bottom 9% |
|
||
| Premium | Premium | Premium |
Housing Supply in Lake Wendouree

The higher the supply score the more supply is on the market, both current and future.
Sources: ABS, GEOSPATIAL, Property Listings, PLANNING ALERTS and Microburbs, 2002 - 2023
Sources: ABS, GEOSPATIAL, Property Listings, PLANNING ALERTS and Microburbs, 2002 - 2023
Lake Wendouree
31.4%
Lake Wendouree
31.4%
Ballarat
34.8%
Ballarat
34.8%
| Field | Value | VS Ballarat | Trend | |
|---|---|---|---|---|
| 118 | Top 17% |
|
||
| 0.1 | Bottom 23% | Data for Jul 2023 | ||
| 42.3 | Top 16% | Data for May 2023 | ||
| Premium | Premium | Premium | ||
| Premium | Premium | Premium | ||
| Premium | Premium | Premium | ||
| 12 lots | Top 35% |
|
||
| Premium | Premium | Premium | ||
| Premium | Premium | Premium | ||
| 16 | Top 10% |
|
Housing Stock Quality in Lake Wendouree
The higher the score, the higher the quality of the houses and units.
Sources: ABS, GEOSPATIAL, Property Listings and Microburbs, 2006 - 2023
Sources: ABS, GEOSPATIAL, Property Listings and Microburbs, 2006 - 2023
| Field | Value | VS Ballarat | Trend | |
|---|---|---|---|---|
| 79.1% | Bottom 12% |
|
||
| 2.2 | Bottom 26% |
|
||
| 69.1% | Top 5% | Data for Jun 2023 |
Development Restrictions in Lake Wendouree

The higher the score, the more easily density can be increased.
Sources: GEOSPATIAL, TORREN, ABS and Microburbs, 2011 - 2023
Sources: GEOSPATIAL, TORREN, ABS and Microburbs, 2011 - 2023
Lake Wendouree
48.7%
Lake Wendouree
48.7%
Ballarat
29.0%
Ballarat
29.0%
| Field | Value | VS Ballarat | Trend | |
|---|---|---|---|---|
| 4.8 sq km | Bottom 40% | Data for Jan 2021 | ||
| 5.1 sq km | Top 2% | Data for Jun 2023 | ||
| 504 sqm per resident | Bottom 29% | Data for Jan 2021 |
Risk in Lake Wendouree

The higher the score, the more exposed households are to financial stress.
Sources: ABS, Property Listings, TORREN and Microburbs, 2006 - 2023
Sources: ABS, Property Listings, TORREN and Microburbs, 2006 - 2023
Lake Wendouree
43.0
Lake Wendouree
43.0
Ballarat
40.0
Ballarat
40.0
| Field | Value | VS Ballarat | Trend | |
|---|---|---|---|---|
| 81.2% | Bottom 19% |
|
||
| 18.8% | Top 19% |
|
||
| 36 | Top 38% | Data for Jun 2023 | ||
| $2,140 | Top 38% |
|
||
| 84 | Top 15% | Data for Jun 2023 | ||
| 81 | Top 19% | Data for Jun 2023 | ||
| 24.8% | Top 35% |
|
||
| 24.2% | Bottom 13% |
|
Housing Demand in Lake Wendouree
The higher the score, the more demand their is for housing in the area, both current and future.
Sources: ABS, TORREN, Property Listings and Microburbs, 2004 - 2030
Sources: ABS, TORREN, Property Listings and Microburbs, 2004 - 2030
Lake Wendouree
62.3%
Lake Wendouree
62.3%
Ballarat
54.4%
Ballarat
54.4%
| Field | Value | VS Ballarat | Trend | |
|---|---|---|---|---|
| Premium | Premium | Premium | ||
| 12000 | Bottom 49% |
|
||
| 121000 | Top 19% |
|
||
| Premium | Premium | Premium | ||
| 127000 | Top 13% |
|
||
| Premium | Premium | Premium | ||
| Premium | Premium | Premium | ||
| Premium | Premium | Premium | ||
| Premium | Premium | Premium |
Unit Market in Lake Wendouree
Sources: Property Listings and Microburbs, 2002 - 2023
| Field | Value | VS Ballarat | Trend | |
|---|---|---|---|---|
| Premium | Premium | Premium | ||
| $364 | Bottom 11% |
|
||
| Premium | Premium | Premium | ||
| 53.1% | Bottom 13% |
|
LGA Details (1)
| Headline | Place | Datetime |
|---|---|---|
| Local government area | Ballarat |
Median House Rental Prices by Street (13)
| Level_0 | Street | Date | Median rent (per week) |
|---|---|---|---|
| 103757 | Forest St | 13 Mar 2025 | $485 |
| 103715 | Drummond St | 13 Mar 2025 | $620 |
| 103793 | Gregory St | 13 Mar 2025 | $405 |
| 103822 | High St | 13 Mar 2025 | $395 |
| 103624 | Burnbank St | 13 Mar 2025 | $445 |
Percent of Renters by Street (55)
| Percent of Renters | Street |
|---|---|
| 18.7% | Alfred St |
| 66.8% | Brawn Ave |
| 100.0% | Buckingham St |
| 74.2% | Burnbank Cl |
| 30.6% | Burnbank St |
Median Unit Sale Prices by Street (100)
| Date | Median sale value | Street |
|---|---|---|
| 10 May 2024 | $297,500 | Gregory St |
| 10 May 2024 | $675,000 | Webster St |
| 06 Oct 2023 | $621,900 | Wendouree Pde |
| 06 Oct 2023 | $453,100 | Lexton St |
| 06 Oct 2023 | $500,000 | Mair St |
Turnover Rate by Street (51)
| Turnover rate | Street | Turnover Label | Turnover Years | Year |
|---|---|---|---|---|
| 76.0% | Drummond St | average turnover | Every 13.2 years (average turnover) | 2025 |
| 71.4% | Burnbank Cl | average turnover | Every 14.0 years (average turnover) | 2025 |
| 104.6% | Gregory St | high turnover | Every 9.6 years (high turnover) | 2025 |
| 100.0% | Forest St | high turnover | Every 10.0 years (high turnover) | 2025 |
| 47.2% | Mair St | very tightly held | Every 21.2 years (very tightly held) | 2025 |
Planning Applications: Dwellings (32)
| Headline | Place | Date |
|---|---|---|
| Partial demolition and alterations to the internal and external fabric and additions to an existing building (City oval grandstand) - Ballarat City Council PLP/2024/479 | 1431 Mair Street, Lake Wendouree VIC 3350 | 12 Dec 2024 |
| Demolition of existing outbuildings and front fence, partial demolition of an alterations and additions to an existing dwelling, removal of a tree and construct a new front fence - Ballarat City Council PLP/2024/287 | 139 Wendouree Parade, Lake Wendouree VIC 3350 | 30 Oct 2024 |
| Demolition of a dwelling, outbuildings and fencing, and development of a dwelling - Ballarat City Council PLP/2024/236 | 50 Victoria Avenue, Lake Wendouree VIC 3350 | 23 Oct 2024 |
| Alterations, addtions and partial demolition of an existing dwelling - Ballarat City Council PLP/2024/107 | 12 Service Street, Lake Wendouree VIC 3350 | 03 Jul 2024 |
| Partial demolition of the existing dwelling, alterations and additions to the existing dwelling, development of an additional dwelling, two lot subdivision, demolition of outbuilding and a construction of a crossover - Ballarat City Council PLP/2023/143 | 30 Hotham Street, Lake Wendouree VIC 3350 | 12 Feb 2024 |
Planning Applications: Other (13)
| Headline | Place | Date |
|---|---|---|
| Construct a dwelling with garage on a lot less than 300 square metres - Ballarat City Council PLP/2023/653 | 1303 Gregory Street, Lake Wendouree VIC 3350 | 18 Dec 2023 |
| Part demolition, alterations and additions to existing dwelling, demolition of one (1) outbuilding (garden shed) and demolition and replacement of carport with rumpus room. - Ballarat City Council PLP/2023/510 | 227 Mill Street, Lake Wendouree VIC 3350 | 04 Oct 2023 |
| Creation of Carriage Easement - Ballarat City Council PLP/2022/110 | 913-917 Macarthur Street, Lake Wendouree VIC 3350 | 16 Feb 2022 |
| Variation of category to Restaurant and cafe Licence - Victorian Commission for Gambling and Liquor Regulation 70746A01 | 31 Burnbank Street, Ballarat 3350, VIC | 06 Dec 2021 |
| Redevelopment of existing hospital, display of business identification signage and alteration of multiple accesses to a road in a Road Zone - Category 1 - Ballarat City Council PLP/2021/636 | 101 Drummond Street North, Lake Wendouree VIC 3350 | 21 Oct 2021 |
Median House Sale Prices by Street (100)
| Street | Date | Median sale value |
|---|---|---|
| Martin Ave | 10 May 2024 | $560,000 |
| Victoria Ave | 10 May 2024 | $1,690,000 |
| Lindisfarne Cr | 10 May 2024 | $720,000 |
| Lexton St | 10 May 2024 | $1,195,000 |
| Parade Ct | 10 May 2024 | $1,950,000 |
Businesses (14)
| Name | Address |
|---|---|
| Peter Jones Builder | 312 Wendouree Parade, Lake Wendouree VIC 3350, Australia |
| Boadle Living | 1416 Gregory Lake St, Ballarat Central VIC 3350, Australia |
| Jens Veal Byrne Pty Ltd | 901 Macarthur St, Lake Wendouree VIC 3350, Australia |
| `pickwick design building design | Unit 1/1364 Gregory St, Lake Wendouree VIC 3350, Australia |
| Miles & Co Builders Pty Ltd | 3, Crocker St |
Accommodation Options (2)
| Name | Address |
|---|---|
| Ronald Cameron Hostel | 1416 Sturt St, Lake Wendouree VIC 3350, Australia |
| Browen-Lee Home | 105, Lexton St |
Recently Sold Houses (100)
| Address | Price | Bedrooms | Bathrooms | Garage spaces | Date sold | Subdivisible into | Sale Type |
|---|---|---|---|---|---|---|---|
| 1125 Gregory St | $800,000 | 4.0 | 1.0 | 2.0 | 06 Mar 2025 | 0 | On Market |
| Unit 2, 1430 Gregory St | $620,000 | 3.0 | 2.0 | 1.0 | 03 Feb 2025 | 0 | On Market |
| 111 Wendouree Pde | $2,300,000 | 2.0 | 3.0 | 3.0 | 07 Jan 2025 | 0 | On Market |
| 18 Burnbank St | $650,000 | 3.0 | 1.0 | 0.0 | 23 Dec 2024 | 0 | On Market |
| 1a Elliott St | $1,525,000 | 5.0 | 3.0 | 2.0 | 16 Dec 2024 | 0 | On Market |
Recent Rental Unit Listings (100)
| Address | Rent (per week) | Bedrooms | Bathrooms | Garage spaces | Date |
|---|---|---|---|---|---|
| Unit 3, 1015 Macarthur St | $380 | 2.0 | 1.0 | 1.0 | 18 Dec 2024 |
| Unit 3, 1015 Macarthur St | $380 | 2.0 | 1.0 | 1.0 | 18 Dec 2024 |
| Unit 3, 1015 Macarthur St | $380 | 2.0 | 1.0 | 1.0 | 18 Dec 2024 |
| Unit 3, 1015 Macarthur St | $380 | 2.0 | 1.0 | 1.0 | 18 Dec 2024 |
| Unit 3, 1015 Macarthur St | $380 | 2.0 | 1.0 | 1.0 | 18 Dec 2024 |
Recent Rental House Listings (100)
| Address | Rent (per week) | Bedrooms | Bathrooms | Garage spaces | Date | Subdivisible into |
|---|---|---|---|---|---|---|
| 114a Wendouree Pde | $650 | 3 | 2 | 2 | 07 Mar 2025 | 0 |
| 114a Wendouree Pde | $750 | 3 | 2 | 2 | 07 Mar 2025 | 0 |
| Unit 10, 464 Wendouree Pde | $360 | 2 | 1 | 1 | 21 Feb 2025 | 0 |
| Unit 10, 464 Wendouree Pde | $360 | 2 | 1 | 1 | 21 Feb 2025 | 0 |
| Unit 10, 464 Wendouree Pde | $360 | 2 | 1 | 1 | 21 Feb 2025 | 0 |
Recently Sold Units (100)
| Address | Price | Bedrooms | Bathrooms | Garage spaces | Date sold | Sale Type |
|---|---|---|---|---|---|---|
| Unit 6, 1015a Gregory St | $392,500 | 2.0 | 1.0 | 1.0 | 28 Feb 2025 | On Market |
| Unit 6, 1015a Gregory St | $392,500 | 2.0 | 1.0 | 1.0 | 28 Feb 2025 | On Market |
| Unit 6, 1015a Gregory St | $392,500 | 2.0 | 1.0 | 1.0 | 28 Feb 2025 | On Market |
| Unit 6, 1015a Gregory St | $392,500 | 2.0 | 1.0 | 1.0 | 28 Feb 2025 | On Market |
| Unit 4, 1110 Gregory St | Price Withheld | 2.0 | 1.0 | 1.0 | 24 Jan 2025 | On Market |
Loading entities ..