.png)
Profiles
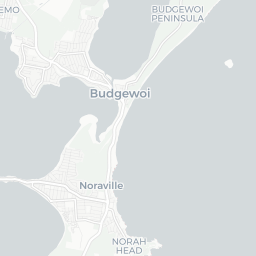
Nearby Suburbs
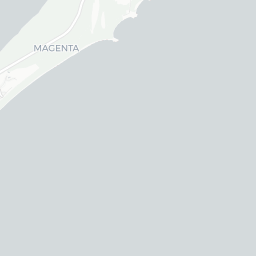
Real Estate Market: Is Magenta (NSW) NSW 2261 a Good Suburb to Buy Into?
Housing Market in Magenta (NSW)

Sources: Property Listings and Microburbs, 2002 - 2023
| Field | Value | VS Central Coast NSW | Trend | |
|---|---|---|---|---|
| Premium | Premium | Premium | ||
| Premium | Premium | Premium | ||
| Premium | Premium | Premium | ||
| $680 | Top 27% |
|
||
| Premium | Premium | Premium |
Housing Supply in Magenta (NSW)

The higher the supply score the more supply is on the market, both current and future.
Sources: ABS, GEOSPATIAL, Property Listings, PLANNING ALERTS, BASIX and Microburbs, 2002 - 2031
Sources: ABS, GEOSPATIAL, Property Listings, PLANNING ALERTS, BASIX and Microburbs, 2002 - 2031
Magenta (NSW)
32.2%
Magenta (NSW)
32.2%
Central Coast NSW
34.1%
Central Coast NSW
34.1%
| Field | Value | VS Central Coast NSW | Trend | |
|---|---|---|---|---|
| 333 | Top 12% |
|
||
| 0.0 | Bottom 10% | Data for Jul 2023 | ||
| 61.2 | Top 11% | Data for May 2023 | ||
| Premium | Premium | Premium | ||
| Premium | Premium | Premium | ||
| Premium | Premium | Premium | ||
| 4 | Bottom 34% | Data for Dec 2020 | ||
| 3 lots | Bottom 28% | Data for May 2023 | ||
| Premium | Premium | Premium | ||
| Premium | Premium | Premium | ||
| Premium | Premium | Premium | ||
| 5 | Top 24% |
|
Housing Stock Quality in Magenta (NSW)
The higher the score, the higher the quality of the houses and units.
Sources: ABS, GEOSPATIAL, Property Listings, BASIX and Microburbs, 2006 - 2023
Sources: ABS, GEOSPATIAL, Property Listings, BASIX and Microburbs, 2006 - 2023
| Field | Value | VS Central Coast NSW | Trend | |
|---|---|---|---|---|
| 51.8% | Bottom 4% |
|
||
| 2.1 | Bottom 20% |
|
||
| 0.0% | Bottom 37% | Data for Jun 2023 | ||
| Premium | Premium | Premium |
Development Restrictions in Magenta (NSW)

The higher the score, the more easily density can be increased.
Sources: GEOSPATIAL, ABS and Microburbs, 2011 - 2023
Sources: GEOSPATIAL, ABS and Microburbs, 2011 - 2023
Magenta (NSW)
46.2%
Magenta (NSW)
46.2%
Central Coast NSW
39.4%
Central Coast NSW
39.4%
| Field | Value | VS Central Coast NSW | Trend | |
|---|---|---|---|---|
| 1.0 sq km | Bottom 8% | Data for Jan 2021 | ||
| 14.1% | Top 8% | Data for Jun 2023 | ||
| 0 | Bottom 16% | Data for Jun 2023 | ||
| 2470 sqm per resident | Top 37% | Data for Jan 2021 |
Risk in Magenta (NSW)

The higher the score, the more exposed households are to financial stress.
Sources: ABS, Property Listings and Microburbs, 2006 - 2023
Sources: ABS, Property Listings and Microburbs, 2006 - 2023
Magenta (NSW)
56.7%
Magenta (NSW)
56.7%
Central Coast NSW
63.0%
Central Coast NSW
63.0%
| Field | Value | VS Central Coast NSW | Trend | |
|---|---|---|---|---|
| 81.8% | Bottom 20% |
|
||
| 18.2% | Top 20% |
|
||
| 57 | Top 8% | Data for Jun 2023 | ||
| $4,920 | Top 2% |
|
||
| 73 | Bottom 21% | Data for Jun 2023 | ||
| 67 | Bottom 12% | Data for Jun 2023 | ||
| 26.7% | Top 27% |
|
||
| 24.0% | Bottom 13% |
|
Housing Demand in Magenta (NSW)
The higher the score, the more demand their is for housing in the area, both current and future.
Sources: ABS, TORREN, Property Listings and Microburbs, 1975 - 2030
Sources: ABS, TORREN, Property Listings and Microburbs, 1975 - 2030
Magenta (NSW)
77.9%
Magenta (NSW)
77.9%
Central Coast NSW
83.0%
Central Coast NSW
83.0%
| Field | Value | VS Central Coast NSW | Trend | |
|---|---|---|---|---|
| 14000 | Top 39% |
|
||
| 172000 | Top 6% |
|
||
| Premium | Premium | Premium | ||
| 352000 | Top 1% |
|
||
| Premium | Premium | Premium | ||
| Premium | Premium | Premium |
Unit Market in Magenta (NSW)
Sources: Property Listings and Microburbs, 2002 - 2023
| Field | Value | VS Central Coast NSW | Trend | |
|---|---|---|---|---|
| Premium | Premium | Premium | ||
| $519 | Top 37% |
|
||
| Premium | Premium | Premium | ||
| 67.4% | Bottom 35% |
|
LGA Details (1)
| Headline | Place | Datetime |
|---|---|---|
| Local government area | Central Coast (NSW) |
Percent of Renters by Street (11)
| Percent of Renters | Street |
|---|---|
| 0.0% | Millbrook Pl |
| 6.6% | Edgewood Pl |
| 17.5% | Huntingdale Dr |
| 0.0% | Birkdale Pl |
| 21.4% | Magenta Dr |
Turnover Rate by Street (10)
| Turnover rate | Street | Turnover Label | Turnover Years | Year |
|---|---|---|---|---|
| 171.4% | Millbrook Pl | very high turnover | Every 5.8 years (very high turnover) | 2025 |
| 142.5% | White Haven Ave | very high turnover | Every 7.0 years (very high turnover) | 2025 |
| 114.7% | Turnberry Ave | very high turnover | Every 8.7 years (very high turnover) | 2025 |
| 92.0% | Edgewood Pl | high turnover | Every 10.9 years (high turnover) | 2025 |
| 91.2% | Pebble Beach Ave | high turnover | Every 11.0 years (high turnover) | 2025 |
Median Unit Sale Prices by Street (100)
| Date | Median sale value | Street |
|---|---|---|
| 31 Aug 2024 | 845600.0 | Birkdale Pl |
| 31 May 2024 | 858800.0 | Birkdale Pl |
| 31 May 2024 | 903500.0 | Huntingdale Dr |
| 31 May 2024 | 1056900.0 | Magenta Dr |
| 31 May 2024 | 1100000.0 | Turnberry Ave |
Recently Sold Houses (100)
| Address | Price | Bedrooms | Bathrooms | Garage spaces | Date sold | Subdivisible into | Sale Type |
|---|---|---|---|---|---|---|---|
| 15 Sawgrass Cr | $1,755,000 | 3.0 | 2.0 | 2.0 | 20 Dec 2024 | 0 | On Market |
| 78 White Haven Ave | $1,510,000 | 0.0 | 0.0 | 0.0 | 08 Oct 2024 | 0 | On Market |
| 2002-2004 Huntingdale Dr | Price Withheld | 3.0 | 3.0 | 3.0 | 05 Sep 2024 | 0 | On Market |
| 2002 Huntingdale Dr | $1,110,000 | 05 Sep 2024 | 0 | On Market | |||
| 2002-2004 Huntingdale Dr | $1,110,000 | 3.0 | 3.0 | 3.0 | 05 Sep 2024 | 0 | On Market |
Planning Applications: Dwellings (2)
| Headline | Place | Date |
|---|---|---|
| Continuation of the Use of the Existing Dwelling House as an Exhibition Home (Amended Application) - Central Coast Council DA/18/2018/A | 2 Pebble Beach Avenue, Magenta, NSW | 01 Feb 2025 |
| Alterations & Additions to Existing Dwellings - Conversion to Single Dwelling - Central Coast Council DA/705/2021 | 22 Edgewood Place, Magenta, NSW | 10 Aug 2021 |
Planning Applications: Other (1)
| Headline | Place | Date |
|---|---|---|
| Awning - Central Coast Council DA/806/2021 | 3 White Haven Avenue, Magenta, NSW | 13 Jul 2021 |
Accommodation Options (2)
| Name | Address |
|---|---|
| Pullman Magenta Shores Resort | 1 Magenta Dr, Magenta NSW 2261, Australia |
| Pullman Magenta Shores Resort | 1, Magenta Dr |
Median House Sale Prices by Street (100)
| Street | Date | Median sale value |
|---|---|---|
| Edgewood Pl | 10 May 2024 | $1,900,000 |
| Huntingdale Dr | 10 May 2024 | $1,350,000 |
| Pebble Beach Ave | 10 May 2024 | $1,845,000 |
| Magenta Dr | 10 May 2024 | $812,500 |
| Millbrook Pl | 10 May 2024 | $887,000 |
Recent Rental Unit Listings (100)
| Address | Rent (per week) | Bedrooms | Bathrooms | Garage spaces | Date |
|---|---|---|---|---|---|
| 2104 Huntingdale Dr | $530 | 1.0 | 1.0 | 1.0 | 30 Nov 2022 |
| 2104 Huntingdale Dr | $530 | 1.0 | 1.0 | 1.0 | 30 Nov 2022 |
| 2104 Huntingdale Dr | $530 | 1.0 | 1.0 | 1.0 | 30 Nov 2022 |
| 2104 Huntingdale Dr | $530 | 1.0 | 1.0 | 1.0 | 30 Nov 2022 |
| 2104 Huntingdale Dr | $530 | 1.0 | 1.0 | 1.0 | 30 Nov 2022 |
Recent Rental House Listings (100)
| Address | Rent (per week) | Bedrooms | Bathrooms | Garage spaces | Date | Subdivisible into |
|---|---|---|---|---|---|---|
| Unit 1003, 3 Birkdale Pl | $800 | 3 | 2 | 1 | 10 Mar 2025 | 0 |
| Unit 1003, 3 Birkdale Pl | $800 | 3 | 2 | 1 | 10 Mar 2025 | 0 |
| 2111 Huntingdale Dr | Price Withheld | 3 | 2 | 2 | 04 Dec 2023 | 0 |
| 2111 Huntingdale Dr | Price Withheld | 3 | 2 | 2 | 04 Dec 2023 | 0 |
| 2111 Huntingdale Dr | $650 | 3 | 2 | 2 | 04 Dec 2023 | 0 |
Recently Sold Units (100)
| Address | Price | Bedrooms | Bathrooms | Garage spaces | Date sold | Sale Type |
|---|---|---|---|---|---|---|
| Unit 401, 3 Turnberry Ave | $750,000 | 18 Oct 2024 | On Market | |||
| Unit 401, 3 Turnberry Ave | $750,000 | 18 Oct 2024 | On Market | |||
| Unit 401, 3 Turnberry Ave | $750,000 | 18 Oct 2024 | On Market | |||
| Unit 401, 3 Turnberry Ave | $750,000 | 2.0 | 2.0 | 1.0 | 18 Oct 2024 | On Market |
| Unit 401, 3 Turnberry Ave | $750,000 | 18 Oct 2024 | On Market |
Loading entities ..