.png)
Profiles
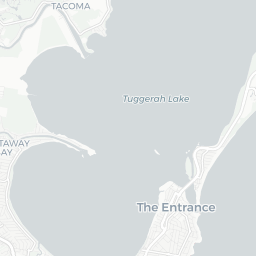
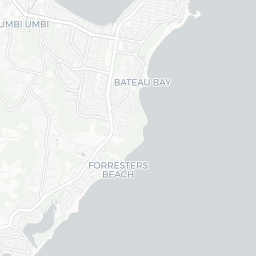
Nearby Suburbs
Real Estate Market: Is The Entrance North NSW 2261 a Good Suburb to Buy Into?
Housing Market in The Entrance North

Sources: Property Listings and Microburbs, 2002 - 2023
| Field | Value | VS Central Coast NSW | Trend | |
|---|---|---|---|---|
| Premium | Premium | Premium | ||
| Premium | Premium | Premium | ||
| Premium | Premium | Premium | ||
| $652 | Top 32% |
|
||
| Premium | Premium | Premium |
Housing Supply in The Entrance North

The higher the supply score the more supply is on the market, both current and future.
Sources: ABS, GEOSPATIAL, Property Listings, PLANNING ALERTS, BASIX and Microburbs, 2002 - 2031
Sources: ABS, GEOSPATIAL, Property Listings, PLANNING ALERTS, BASIX and Microburbs, 2002 - 2031
The Entrance North
33.7%
The Entrance North
33.7%
Central Coast NSW
34.1%
Central Coast NSW
34.1%
| Field | Value | VS Central Coast NSW | Trend | |
|---|---|---|---|---|
| 201 | Top 15% |
|
||
| 1.7 | Bottom 38% | Data for Jul 2023 | ||
| 74.9 | Top 7% | Data for May 2023 | ||
| Premium | Premium | Premium | ||
| Premium | Premium | Premium | ||
| Premium | Premium | Premium | ||
| 6 | Bottom 43% |
|
||
| 2 lots | Bottom 16% | Data for Oct 2020 | ||
| Premium | Premium | Premium | ||
| Premium | Premium | Premium | ||
| Premium | Premium | Premium | ||
| 4 | Top 26% |
|
Housing Stock Quality in The Entrance North
The higher the score, the higher the quality of the houses and units.
Sources: ABS, GEOSPATIAL, Property Listings, BASIX and Microburbs, 2006 - 2023
Sources: ABS, GEOSPATIAL, Property Listings, BASIX and Microburbs, 2006 - 2023
| Field | Value | VS Central Coast NSW | Trend | |
|---|---|---|---|---|
| 50.6% | Bottom 4% |
|
||
| 2.3 | Bottom 34% | Data for Jan 2021 | ||
| 0.0% | Bottom 37% | Data for Jun 2023 | ||
| Premium | Premium | Premium |
Development Restrictions in The Entrance North

The higher the score, the more easily density can be increased.
Sources: GEOSPATIAL, ABS and Microburbs, 2011 - 2023
Sources: GEOSPATIAL, ABS and Microburbs, 2011 - 2023
The Entrance North
38.4%
The Entrance North
38.4%
Central Coast NSW
39.4%
Central Coast NSW
39.4%
| Field | Value | VS Central Coast NSW | Trend | |
|---|---|---|---|---|
| 1.1 sq km | Bottom 10% | Data for Jan 2021 | ||
| 0.53 | Bottom 26% | Data for Feb 2023 | ||
| 2.1% | Top 22% | Data for Jun 2023 | ||
| 4 | Top 30% | Data for Jun 2023 | ||
| 438 sqm per resident | Bottom 24% | Data for Jan 2021 |
Risk in The Entrance North

The higher the score, the more exposed households are to financial stress.
Sources: ABS, Property Listings and Microburbs, 2006 - 2023
Sources: ABS, Property Listings and Microburbs, 2006 - 2023
The Entrance North
67.8%
The Entrance North
67.8%
Central Coast NSW
63.0%
Central Coast NSW
63.0%
| Field | Value | VS Central Coast NSW | Trend | |
|---|---|---|---|---|
| 66.7% | Bottom 4% |
|
||
| 33.3% | Top 4% |
|
||
| 55 | Top 9% | Data for Jun 2023 | ||
| $2,170 | Top 36% |
|
||
| 73 | Bottom 23% | Data for Jun 2023 | ||
| 67 | Bottom 13% | Data for Jun 2023 | ||
| 37.4% | Top 6% |
|
||
| 28.8% | Bottom 22% |
|
Housing Demand in The Entrance North
The higher the score, the more demand their is for housing in the area, both current and future.
Sources: ABS, TORREN, Property Listings and Microburbs, 2004 - 2030
Sources: ABS, TORREN, Property Listings and Microburbs, 2004 - 2030
The Entrance North
81.5%
The Entrance North
81.5%
Central Coast NSW
83.0%
Central Coast NSW
83.0%
| Field | Value | VS Central Coast NSW | Trend | |
|---|---|---|---|---|
| 14000 | Top 39% |
|
||
| 172000 | Top 6% |
|
||
| Premium | Premium | Premium | ||
| 352000 | Top 1% |
|
||
| Premium | Premium | Premium | ||
| Premium | Premium | Premium | ||
| Premium | Premium | Premium |
Unit Market in The Entrance North
Sources: Property Listings and Microburbs, 2002 - 2023
| Field | Value | VS Central Coast NSW | Trend | |
|---|---|---|---|---|
| Premium | Premium | Premium | ||
| $506 | Top 44% |
|
||
| Premium | Premium | Premium | ||
| 70.1% | Bottom 44% |
|
Accommodation Options (7)
| Headline | Place | Datetime |
|---|---|---|
| Two Shores Holiday Village | 25 Wilfred Barrett Dr | |
| Lake Front Motel | 6/8 Coogee Ave | |
| Michelle Maree | 10-12 Hargraves St | |
Planning Applications: Other (12)
| Headline | Place | Date |
|---|---|---|
| Remediation Works - Removal of Asbestos from Soil (Amended Application) - Central Coast Council DA/158/2024/A | 77 Hutton Road, The Entrance North, NSW | 11 Dec 2024 |
| Liquor licence transfer - with licensee consent - on premises - NSW Independent Liquor and Gaming Authority SR0001334980 | 20a Hargraves St, The Entrance North NSW 2261 | 21 Nov 2024 |
| Liquor licence transfer - with licensee consent - on premises - NSW Independent Liquor and Gaming Authority SR0001334980 | 20a Hargraves St, The Entrance North NSW 2261 | 21 Nov 2024 |
| Coastal Protection Works (The Determining Authority will be the Hunter & Central Coast Regional Planning Panel.) - Central Coast Council DA/1685/2024 | 9 Hutton Road, The Entrance North, NSW | 24 Oct 2024 |
| Liquor licence transfer - with licensee consent - on premises - NSW Independent Liquor and Gaming Authority SR0001231797 | Hutton Rd, The Entrance North NSW 2261 | 20 Oct 2024 |
Planning Applications: Dwellings (9)
| Headline | Place | Date |
|---|---|---|
| Residential Flat Development consisting of 3 Townhouses, Demolition of Existing Dwelling & Strata Subdivision NOMINATED INTEGRATED - Approval is also sought from the Department of Planning - Water (NRAR)- under the Water Management Act 2000 - Central Coast Council DA/1101/2023 | 4 Brogden Road, The Entrance North, NSW | 02 Aug 2023 |
| Dwelling and inground pool - Central Coast Council DA/1958/2022 | 34 Manly Parade, The Entrance North, NSW | 21 Jul 2022 |
| Dwelling, Demolition - Central Coast Council DA/1280/2021 | 21 Coogee Avenue, The Entrance North, NSW | 22 Sep 2021 |
| Secondary dwelling - Central Coast Council DA/435/2021 | 25 Bondi Road, The Entrance North, NSW | 02 Aug 2021 |
| Dwelling, Garage, Pool House & Swimming Pool (amended application) - Central Coast Council DA/917/2020/B | 24 Bondi Road, The Entrance North, NSW | 18 May 2021 |
Businesses (6)
| Name | Address |
|---|---|
| Designd | |
| Luthy's Plastering & Building Services | 1/ 55 Hutton Rd |
| TG Complete Carpentry | |
| Warrick Piefke Carpentry | |
| Luthy's Plastering & Building Services | 1/ 55 Hutton Rd |
LGA Details (1)
| Headline | Place | Datetime |
|---|---|---|
| Local government area | Central Coast (NSW) |
Median House Rental Prices by Street (8)
| Street | Date | Median rent (per week) |
|---|---|---|
| Hutton Rd | 21 Mar 2025 | $552 |
| Bondi Rd | 21 Mar 2025 | $730 |
| Brogden Rd | 21 Mar 2025 | $625 |
| Stewart St | 21 Mar 2025 | $810 |
| Manly Pde | 21 Mar 2025 | $700 |
Percent of Renters by Street (19)
| Percent of Renters | Street |
|---|---|
| 37.6% | Florida St |
| 18.7% | Brogden Rd |
| 14.3% | Denniss Rd |
| 0.0% | Dunleith St |
| 17.4% | Hutton Rd |
Turnover Rate by Street (17)
| Turnover rate | Street | Turnover Label | Turnover Years | Year |
|---|---|---|---|---|
| 74.6% | Bondi Rd | average turnover | Every 13.4 years (average turnover) | 2025 |
| 86.5% | Curtis Pde | average turnover | Every 11.6 years (average turnover) | 2025 |
| 79.5% | Hutton Rd | average turnover | Every 12.6 years (average turnover) | 2025 |
| 106.7% | Mini St | high turnover | Every 9.4 years (high turnover) | 2025 |
| 165.7% | Wilfred Barrett Dr | very high turnover | Every 6.0 years (very high turnover) | 2025 |
Median Unit Sale Prices by Street (100)
| Date | Median sale value | Street |
|---|---|---|
| 10 May 2024 | $750,000 | Hutton Rd |
| 10 May 2024 | $1,600,000 | Curtis Pde |
| 10 May 2024 | $512,500 | Coogee Ave |
| 10 May 2024 | $557,500 | Mini St |
| 31 May 2024 | 693500.0 | Bondi Rd |
Recently Sold Houses (100)
| Address | Price | Bedrooms | Bathrooms | Garage spaces | Date sold | Subdivisible into | Sale Type |
|---|---|---|---|---|---|---|---|
| 80 Hutton Rd | Price Withheld | 2.0 | 1.0 | 0.0 | 22 Jan 2025 | 0 | On Market |
| 9 Bondi Rd | $1,250,000 | 4.0 | 3.0 | 4.0 | 18 Dec 2024 | 0 | On Market |
| 10 Wilfred Barrett Dr | $1,100,000 | 06 Dec 2024 | 0 | On Market | |||
| 35 Florida St | $1,675,000 | 6.0 | 4.0 | 2.0 | 06 Dec 2024 | 0 | On Market |
| 10 Wilfred Barrett Dr | $1,100,000 | 4.0 | 3.0 | 3.0 | 06 Dec 2024 | 0 | On Market |
Median House Sale Prices by Street (100)
| Street | Date | Median sale value |
|---|---|---|
| Coogee Ave | 10 May 2024 | $1,268,000 |
| Curtis Pde | 10 May 2024 | $1,500,000 |
| Stewart St | 10 May 2024 | $900,000 |
| Bondi Rd | 10 May 2024 | $1,400,000 |
| Hutton Rd | 10 May 2024 | $900,000 |
Recent Rental Unit Listings (100)
| Address | Rent (per week) | Bedrooms | Bathrooms | Garage spaces | Date |
|---|---|---|---|---|---|
| Unit 2, 93 Hutton Rd | $400 | 2.0 | 1.0 | 1.0 | 19 Feb 2025 |
| Unit 2, 93 Hutton Rd | $400 | 2.0 | 1.0 | 1.0 | 18 Feb 2025 |
| Unit 8, 54-66 Hutton Rd | $450 | 1.0 | 1.0 | 1.0 | 12 Feb 2025 |
| Unit 8, 54-66 Hutton Rd | $450 | 1.0 | 1.0 | 1.0 | 12 Feb 2025 |
| Unit 8, 54-66 Hutton Rd | $450 | 1.0 | 1.0 | 1.0 | 12 Feb 2025 |
Recent Rental House Listings (100)
| Address | Rent (per week) | Bedrooms | Bathrooms | Garage spaces | Date | Subdivisible into |
|---|---|---|---|---|---|---|
| 50 Coogee Ave | $750 | 3 | 1 | 1 | 27 Feb 2025 | 0 |
| 107 Hutton Rd | $720 | 4 | 2 | 3 | 26 Feb 2025 | 0 |
| 107 Hutton Rd | $720 | 4 | 2 | 3 | 26 Feb 2025 | 0 |
| 107 Hutton Rd | $720 | 4 | 2 | 3 | 26 Feb 2025 | 0 |
| 107 Hutton Rd | $720 | 4 | 2 | 3 | 26 Feb 2025 | 0 |
Recently Sold Units (100)
| Address | Price | Bedrooms | Bathrooms | Garage spaces | Date sold | Sale Type |
|---|---|---|---|---|---|---|
| Unit 3, 141 Hutton Rd | $1,025,000 | 3.0 | 2.0 | 2.0 | 14 Mar 2025 | On Market |
| Unit 3, 141 Hutton Rd | $1,025,000 | 3.0 | 2.0 | 2.0 | 14 Mar 2025 | On Market |
| Unit 3, 141 Hutton Rd | $1,025,000 | 3.0 | 2.0 | 2.0 | 14 Mar 2025 | On Market |
| Unit 14, 74 Hutton Rd | Price Withheld | 3.0 | 2.0 | 2.0 | 24 Feb 2025 | On Market |
| Unit 14, 74 Hutton Rd | $930,000 | 24 Feb 2025 | On Market |
Loading entities ..