Copyright Microburbs Pty Ltd 2014-
2025
.
Contact us
for licensing
Close
GET REPORT
New
Explorer
Profile Page
Logout
Sign Up
Login
Blog
Products
Subscriptions
Suburb Finder
Suburb Reports
Suburb DataExplorer
Free Data Consultation
API Access
Consulting Services
AI Property Finder
Coming Soon
Suburb Finder
2025 Suburb Reports
AI Property Finder
Profiles
People & Lifestyle
Crime & Disadvantage
Real Estate
Affluence & Economy
Environment
Nearby Suburbs
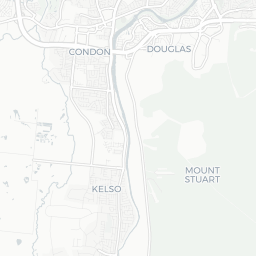
Kelso (Qld)
Condon
Douglas (Townsville - Qld)
Oak Valley (Qld)
Murray
Ross River
Roseneath
Rasmussen
Pinnacles
Thuringowa Central
Real Estate Market: Is Mount Stuart (Qld) QLD 4811 a Good Suburb to Buy Into?
Housing Market in Mount Stuart (Qld)
Key Mount Stuart (Qld) Metrics & Forecast to 2028
Sample Graphic
Sources: Property Listings and Microburbs, 2006 - 2023
Field
Value
VS Townsville
Trend
Capital Growth Forecast: Houses
Premium
Premium
Premium
Capital Growth Forecast: Houses (2-Year Outlook)
Premium
Premium
Premium
Housing Supply in Mount Stuart (Qld)
Mount Stuart (Qld) Real Estate Investor Report
Sample Graphic
The higher the supply score the more supply is on the market, both current and future.
Sources: ABS, GEOSPATIAL, PLANNING ALERTS and Microburbs, 2002 - 2023
Mount Stuart (Qld)
59.2%
Mount Stuart (Qld)
59.2%
Townsville
35.4%
Townsville
35.4%
Compare
Suburbs
Field
Value
VS Townsville
Trend
Developments
7.5
Top 21%
Data for Jul 2023
Housing Stock Quality Indicator
Total new residential buildings value (SA2)
Premium
Premium
Premium
Volume of houses sold in the last 30 days
Premium
Premium
Premium
Volume of units sold in the last 30 days
Premium
Premium
Premium
Housing Stock Quality in Mount Stuart (Qld)
The higher the score, the higher the quality of the houses and units.
Sources: ABS, GEOSPATIAL and Microburbs, 2006 - 2023
Field
Value
VS Townsville
Trend
Average bedrooms - all homes
0.0
Bottom 2%
Data for Jan 2021
NBN connection: fibreoptic cable to node
0.4%
Top 22%
Data for Jun 2023
Development Restrictions in Mount Stuart (Qld)
Mount Stuart (Qld) Zoning Map
Sample Graphic
The higher the score, the more easily density can be increased.
Sources: GEOSPATIAL, TORREN and Microburbs, 2011 - 2023
Mount Stuart (Qld)
38.9%
Mount Stuart (Qld)
38.9%
Townsville
38.1%
Townsville
38.1%
Compare
Suburbs
Field
Value
VS Townsville
Trend
Heritage sites total area
0.0 sq km
Bottom 39%
Data for Jun 2023
Risk in Mount Stuart (Qld)
Mount Stuart (Qld) Risk Report
Sample Graphic
The higher the score, the more exposed households are to financial stress.
Sources: ABS, Property Listings, TORREN and Microburbs, 2006 - 2023
Mount Stuart (Qld)
48.0
Mount Stuart (Qld)
48.0
Townsville
46.1
Townsville
46.1
Compare
Suburbs
Field
Value
VS Townsville
Trend
Housing Affordability Index
24
Bottom 21%
Data for Jun 2023
Rent Affordability Index (Houses)
84
Top 18%
Data for Jun 2023
Rent Affordability Index (Units)
83
Top 10%
Data for Jun 2023
Housing Demand in Mount Stuart (Qld)
The higher the score, the more demand their is for housing in the area, both current and future.
Sources: ABS, TORREN and Microburbs, 2006 - 2030
Mount Stuart (Qld)
69.4%
Mount Stuart (Qld)
69.4%
Townsville
62.0%
Townsville
62.0%
Compare
Suburbs
Field
Value
VS Townsville
Trend
Net internal migration (LGA)
Premium
Premium
Premium
Net overseas migration (LGA)
Premium
Premium
Premium
Future Population (SA2)
20900
Top 12%
160% to Dec 2046
Historical Population (SA3)
201000
Top 2%
41% to Dec 2023
Population (LGA)
224000
Top 6%
57% to Dec 2030
Population Projection (LGA)
Premium
Premium
Premium
LGA Details (1)
Headline
Place
Datetime
Local government area
Townsville
Businesses (1)
Name
Address
North Coast Kerbing Pty Ltd
Townsville QLD 4814, Australia
Percent of Renters by Street (1)
Percent of Renters
Street
0.0%
Mount Stuart Rd
Loading entities ..
+
−
Leaflet
Subscribe
to see the map content. See samples:
Surry Hills (NSW)
St Kilda (Vic.)
Fortitude Valley
Kent Town
Northbridge (WA)
Darwin City
Glenorchy (Tas.)
Expand ↗️
Loading Choropleth Data
Min
Max
Subscribe
to see the timeline. See samples:
Surry Hills (NSW)
St Kilda (Vic.)
Fortitude Valley
Kent Town
Northbridge (WA)
Darwin City
Glenorchy (Tas.)
Profiles
People & Lifestyle
Crime & Disadvantage
Real Estate
Affluence & Economy
Environment
Nearby Suburbs
Kelso (Qld)
Condon
Douglas (Townsville - Qld)
Oak Valley (Qld)
Murray
Ross River
Roseneath
Rasmussen
Pinnacles
Thuringowa Central
.png)