.png)
Profiles
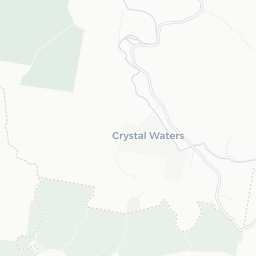
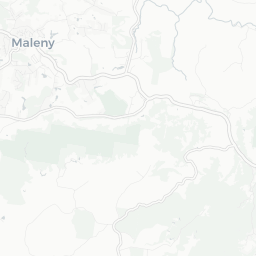
Nearby Suburbs
Real Estate Market: Is Reesville QLD 4552 a Good Suburb to Buy Into?
Housing Market in Reesville

Sources: Property Listings and Microburbs, 2002 - 2023
| Field | Value | VS Sunshine Coast | Trend | |
|---|---|---|---|---|
| Premium | Premium | Premium | ||
| Premium | Premium | Premium | ||
| Premium | Premium | Premium | ||
| $796 | Top 12% |
|
||
| Premium | Premium | Premium |
Housing Supply in Reesville

The higher the supply score the more supply is on the market, both current and future.
Sources: ABS, GEOSPATIAL, Property Listings, PLANNING ALERTS and Microburbs, 2002 - 2023
Sources: ABS, GEOSPATIAL, Property Listings, PLANNING ALERTS and Microburbs, 2002 - 2023
Reesville
43.9%
Reesville
43.9%
Sunshine Coast
33.9%
Sunshine Coast
33.9%
| Field | Value | VS Sunshine Coast | Trend | |
|---|---|---|---|---|
| 0 | Bottom 38% | Data for Jun 2025 | ||
| 0.7 | Bottom 31% | Data for Jul 2023 | ||
| 65.7 | Top 10% | Data for May 2023 | ||
| Premium | Premium | Premium | ||
| Premium | Premium | Premium | ||
| Premium | Premium | Premium | ||
| Premium | Premium | Premium | ||
| Premium | Premium | Premium | ||
| 3 | Top 30% |
|
Housing Stock Quality in Reesville
The higher the score, the higher the quality of the houses and units.
Sources: ABS, GEOSPATIAL, Property Listings and Microburbs, 2006 - 2023
Sources: ABS, GEOSPATIAL, Property Listings and Microburbs, 2006 - 2023
| Field | Value | VS Sunshine Coast | Trend | |
|---|---|---|---|---|
| 100.0% | Top 31% |
|
||
| 2.3 | Bottom 34% |
|
||
| 0.0% | Bottom 37% | Data for Jun 2023 |
Development Restrictions in Reesville

The higher the score, the more easily density can be increased.
Sources: GEOSPATIAL, TORREN, ABS and Microburbs, 2011 - 2023
Sources: GEOSPATIAL, TORREN, ABS and Microburbs, 2011 - 2023
Reesville
39.1%
Reesville
39.1%
Sunshine Coast
41.2%
Sunshine Coast
41.2%
| Field | Value | VS Sunshine Coast | Trend | |
|---|---|---|---|---|
| 5.6 sq km | Bottom 43% | Data for Jan 2021 | ||
| 0.0 sq km | Bottom 39% | Data for Jun 2023 | ||
| 409 sqm per resident | Bottom 21% | Data for Jan 2021 |
Risk in Reesville

The higher the score, the more exposed households are to financial stress.
Sources: ABS, Property Listings, TORREN and Microburbs, 2006 - 2023
Sources: ABS, Property Listings, TORREN and Microburbs, 2006 - 2023
Reesville
49.6%
Reesville
49.6%
Sunshine Coast
67.4%
Sunshine Coast
67.4%
| Field | Value | VS Sunshine Coast | Trend | |
|---|---|---|---|---|
| 93.6% | Top 44% |
|
||
| 6.4% | Bottom 44% |
|
||
| 62 | Top 5% | Data for Jun 2023 | ||
| $3,380 | Top 6% |
|
||
| 65 | Bottom 5% | Data for Jun 2023 | ||
| 64 | Bottom 9% | Data for Jun 2023 | ||
| 31.1% | Top 13% |
|
||
| 25.2% | Bottom 15% |
|
Housing Demand in Reesville
The higher the score, the more demand their is for housing in the area, both current and future.
Sources: ABS, TORREN, Property Listings and Microburbs, 1975 - 2030
Sources: ABS, TORREN, Property Listings and Microburbs, 1975 - 2030
Reesville
72.2%
Reesville
72.2%
Sunshine Coast
80.6%
Sunshine Coast
80.6%
| Field | Value | VS Sunshine Coast | Trend | |
|---|---|---|---|---|
| Premium | Premium | Premium | ||
| 9990 | Top 46% |
|
||
| 65100 | Top 49% |
|
||
| Premium | Premium | Premium | ||
| 413000 | Top 1% |
|
||
| Premium | Premium | Premium | ||
| Premium | Premium | Premium | ||
| Premium | Premium | Premium |
Unit Market in Reesville
Sources: Property Listings and Microburbs, 2002 - 2023
| Field | Value | VS Sunshine Coast | Trend | |
|---|---|---|---|---|
| Premium | Premium | Premium | ||
| 132.0% | Top 3% |
|
LGA Details (1)
| Headline | Place | Datetime |
|---|---|---|
| Local government area | Sunshine Coast |
Median House Rental Prices by Street (2)
| Level_0 | Street | Date | Median rent (per week) |
|---|---|---|---|
| 71219 | Corks Pocket Rd | 16 Feb 2025 | $732 |
| 71220 | Kings Ln | 16 Feb 2025 | $625 |
Percent of Renters by Street (17)
| Percent of Renters | Street |
|---|---|
| 0.0% | Burnett Ln |
| 0.0% | Cecelia Ln |
| 4.1% | Corks Pocket Rd |
| 0.0% | Engle Rd |
| 0.0% | Denning Rd |
Turnover Rate by Street (17)
| Turnover rate | Street | Turnover Label | Turnover Years | Year |
|---|---|---|---|---|
| 61.1% | Kings Ln | quite tightly held | Every 16.4 years (quite tightly held) | 2025 |
| 65.2% | Watson Ln | quite tightly held | Every 15.3 years (quite tightly held) | 2025 |
| 47.1% | Ruddle Dr | very tightly held | Every 21.2 years (very tightly held) | 2025 |
| 75.0% | Denning Rd | average turnover | Every 13.3 years (average turnover) | 2025 |
| 84.0% | Meadow Rd | average turnover | Every 11.9 years (average turnover) | 2025 |
Recently Sold Houses (97)
| Address | Price | Bedrooms | Bathrooms | Garage spaces | Date sold | Subdivisible into | Sale Type |
|---|---|---|---|---|---|---|---|
| 140 Kings Ln | Price Withheld | 4.0 | 2.0 | 6.0 | 23 Dec 2024 | 0 | On Market |
| 224 Doyle Rd | $1,000,000 | 2.0 | 1.0 | 4.0 | 16 Dec 2024 | 0 | On Market |
| 19 Corks Pocket Rd | Price Withheld | 4.0 | 1.0 | 9.0 | 26 Sep 2024 | 0 | On Market |
| 281 Reesville Rd | $1,750,000 | 4.0 | 3.0 | 4.0 | 16 Sep 2024 | 0 | On Market |
| 50 Watson Ln | $1,630,000 | 4.0 | 2.0 | 4.0 | 12 Sep 2024 | 0 | On Market |
Planning Applications: Other (3)
| Headline | Place | Date |
|---|---|---|
| Short Term Accommodation (1 x Cabin) - Sunshine Coast Regional Council MCU24/0062 | 256 Reesville Rd Reesville QLD | 21 Mar 2024 |
| Town Planning Consent Application to Extend an Existing Rural Resort by Adding Two (2) Cottages One (1) Chapel Accommodation for Stable Hand and Additions to Games Room - Sunshine Coast Regional Council 1991/10031.01 | 366 Reesville Rd Reesville QLD | 06 Jan 2024 |
| Town Planning Consent Application to Extend an Existing Rural Resort by Adding Two (2) Cottages One (1) Chapel Accommodation for Stable Hand and Additions to Games Room - Sunshine Coast Regional Council MCU24/0001 | 366 Reesville Rd Reesville QLD | 04 Jan 2024 |
Planning Applications: Dwellings (1)
| Headline | Place | Date |
|---|---|---|
| Dwelling House - Rod & Lindy Chan - Urban Catalyst 3 Pty Ltd - Sunshine Coast Regional Council MCU20/0344 | 1-85 Doyle Rd Reesville | 02 Dec 2020 |
Accommodation Options (1)
| Name | Address |
|---|---|
| Maleny Country Cottages | Corks Pocket Rd |
Businesses (1)
| Name | Address |
|---|---|
| Gardner Noel Designs | 30, Watson Lane, Reesville |
Median House Sale Prices by Street (100)
| Street | Date | Median sale value |
|---|---|---|
| Corks Pocket Rd | 10 May 2024 | $1,289,000 |
| Reesville Rd | 10 May 2024 | $2,075,000 |
| Ridley Rd | 06 Oct 2023 | $2,850,000 |
| Watson Ln | 06 Oct 2023 | $1,272,000 |
| Meadow Rd | 06 Oct 2023 | $1,400,000 |
Recent Rental House Listings (100)
| Address | Rent (per week) | Bedrooms | Bathrooms | Garage spaces | Date | Subdivisible into |
|---|---|---|---|---|---|---|
| 19 Cumner Ln | $950 | 4 | 3 | 3 | 15 Jul 2024 | 0 |
| 19 Cumner Ln | $950 | 4 | 3 | 3 | 15 Jul 2024 | 0 |
| 19 Cumner Ln | $950 | 4 | 3 | 3 | 15 Jul 2024 | 0 |
| 19 Cumner Ln | $950 | 4 | 3 | 3 | 15 Jul 2024 | 0 |
| 19 Cumner Ln | $950 | 4 | 3 | 3 | 15 Jul 2024 | 0 |
Recently Sold Units (100)
| Address | Price | Bedrooms | Bathrooms | Garage spaces | Date sold | Sale Type |
|---|---|---|---|---|---|---|
| 224 Doyle Rd | $1,000,000 | 2.0 | 1.0 | 4.0 | 16 Dec 2024 | On Market |
| 224 Doyle Rd | $1,000,000 | 2.0 | 1.0 | 4.0 | 16 Dec 2024 | On Market |
| 224 Doyle Rd | $1,000,000 | 2.0 | 1.0 | 4.0 | 16 Dec 2024 | On Market |
| 224 Doyle Rd | $1,000,000 | 2.0 | 1.0 | 4.0 | 16 Dec 2024 | On Market |
| 224 Doyle Rd | $1,000,000 | 2.0 | 1.0 | 4.0 | 16 Dec 2024 | On Market |
Loading entities ..