.png)
Profiles
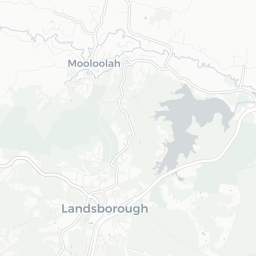
Nearby Suburbs
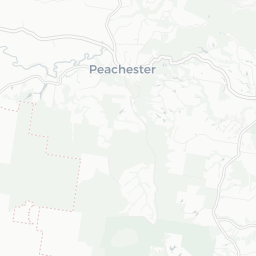
Real Estate Market: Is Wootha QLD 4552 a Good Suburb to Buy Into?
Housing Market in Wootha

Sources: Property Listings and Microburbs, 2002 - 2023
| Field | Value | VS Sunshine Coast | Trend | |
|---|---|---|---|---|
| Premium | Premium | Premium | ||
| Premium | Premium | Premium | ||
| Premium | Premium | Premium | ||
| $750 | Top 19% |
|
||
| Premium | Premium | Premium |
Housing Supply in Wootha

The higher the supply score the more supply is on the market, both current and future.
Sources: ABS, GEOSPATIAL, Property Listings, PLANNING ALERTS and Microburbs, 2002 - 2023
Sources: ABS, GEOSPATIAL, Property Listings, PLANNING ALERTS and Microburbs, 2002 - 2023
Wootha
42.9%
Wootha
42.9%
Sunshine Coast
33.9%
Sunshine Coast
33.9%
| Field | Value | VS Sunshine Coast | Trend | |
|---|---|---|---|---|
| 0 | Bottom 38% | Data for Jun 2025 | ||
| 1.5 | Bottom 37% | Data for Jul 2023 | ||
| Premium | Premium | Premium | ||
| Premium | Premium | Premium | ||
| Premium | Premium | Premium | ||
| Premium | Premium | Premium | ||
| 2 | Top 33% |
|
Housing Stock Quality in Wootha
The higher the score, the higher the quality of the houses and units.
Sources: ABS, GEOSPATIAL, Property Listings and Microburbs, 2006 - 2023
Sources: ABS, GEOSPATIAL, Property Listings and Microburbs, 2006 - 2023
| Field | Value | VS Sunshine Coast | Trend | |
|---|---|---|---|---|
| 100.0% | Top 31% |
|
||
| 2.7 | Top 30% |
|
||
| 0.0% | Bottom 37% | Data for Jun 2023 |
Development Restrictions in Wootha

The higher the score, the more easily density can be increased.
Sources: GEOSPATIAL, TORREN and Microburbs, 2011 - 2023
Sources: GEOSPATIAL, TORREN and Microburbs, 2011 - 2023
Wootha
39.6%
Wootha
39.6%
Sunshine Coast
41.2%
Sunshine Coast
41.2%
| Field | Value | VS Sunshine Coast | Trend | |
|---|---|---|---|---|
| 0.0 sq km | Bottom 39% | Data for Jun 2023 |
Risk in Wootha

The higher the score, the more exposed households are to financial stress.
Sources: ABS, Property Listings, TORREN and Microburbs, 2006 - 2023
Sources: ABS, Property Listings, TORREN and Microburbs, 2006 - 2023
Wootha
54.0%
Wootha
54.0%
Sunshine Coast
67.4%
Sunshine Coast
67.4%
| Field | Value | VS Sunshine Coast | Trend | |
|---|---|---|---|---|
| 100.0% | Top 11% | Data for May 2023 | ||
| 0.0% | Bottom 11% | Data for May 2023 | ||
| 60 | Top 6% | Data for Jun 2023 | ||
| $2,380 | Top 27% |
|
||
| 64 | Bottom 4% | Data for Jun 2023 | ||
| 67 | Bottom 12% | Data for Jun 2023 | ||
| 28.8% | Top 19% |
|
||
| 24.0% | Bottom 13% |
|
Housing Demand in Wootha
The higher the score, the more demand their is for housing in the area, both current and future.
Sources: ABS, TORREN, Property Listings and Microburbs, 1975 - 2030
Sources: ABS, TORREN, Property Listings and Microburbs, 1975 - 2030
Wootha
75.0%
Wootha
75.0%
Sunshine Coast
80.6%
Sunshine Coast
80.6%
| Field | Value | VS Sunshine Coast | Trend | |
|---|---|---|---|---|
| Premium | Premium | Premium | ||
| 9990 | Top 46% |
|
||
| 65100 | Top 49% |
|
||
| Premium | Premium | Premium | ||
| 413000 | Top 1% |
|
||
| Premium | Premium | Premium | ||
| Premium | Premium | Premium | ||
| Premium | Premium | Premium |
Unit Market in Wootha
Sources: Property Listings and Microburbs, 2002 - 2023
| Field | Value | VS Sunshine Coast | Trend | |
|---|---|---|---|---|
| Premium | Premium | Premium | ||
| Premium | Premium | Premium | ||
| Premium | Premium | Premium | ||
| 118.0% | Top 4% |
|
LGA Details (1)
| Headline | Place | Datetime |
|---|---|---|
| Local government area | Sunshine Coast |
Accommodation Options (3)
| Headline | Place | Datetime |
|---|---|---|
| Braeside Bed & Breakfast | 305 Maleny Stanley River Rd | |
Percent of Renters by Street (10)
| Percent of Renters | Street |
|---|---|
| 37.5% | Burnett Ln |
| 0.0% | Denning Rd |
| 0.0% | Doyle Rd |
| 0.0% | Geraghty Ln |
| 5.3% | Maleny-Stanley River Rd |
Turnover Rate by Street (7)
| Turnover rate | Street | Turnover Label | Turnover Years | Year |
|---|---|---|---|---|
| 18.2% | Policeman Spur Rd | very tightly held | Every 55.0 years (very tightly held) | 2025 |
| 121.4% | Maleny-Stanley River Rd | very high turnover | Every 8.2 years (very high turnover) | 2025 |
| 40.0% | Burnett Ln | very tightly held | Every 25.0 years (very tightly held) | 2025 |
| 81.0% | River Rd | average turnover | Every 12.4 years (average turnover) | 2025 |
| 100.0% | Geraghty Ln | high turnover | Every 10.0 years (high turnover) | 2025 |
Recently Sold Houses (19)
| Address | Price | Bedrooms | Bathrooms | Garage spaces | Date sold | Subdivisible into | Sale Type |
|---|---|---|---|---|---|---|---|
| 643 Maleny-stanley River Rd | Price Withheld | 3.0 | 2.0 | 2.0 | 05 Dec 2024 | 0 | On Market |
| 138 Geraghty Ln | $2,500,000 | 4.0 | 4.0 | 7.0 | 19 Aug 2024 | 0 | On Market |
| 505 River Rd | Price Withheld | 4.0 | 2.0 | 24 Jul 2023 | 0 | On Market | |
| 505 River Rd | Price Withheld | 4.0 | 2.0 | 6.0 | 24 Jul 2023 | 0 | On Market |
| 505 River Rd | Price Withheld | 4.0 | 2.0 | 12 Jul 2023 | 0 | On Market |
Planning Applications: Other (3)
| Headline | Place | Date |
|---|---|---|
| Change to Approval - Outdoor Sport, Recreation and Entertainment & Function Room - Maleny Botanic Gardens - Covey Associates - Sunshine Coast Regional Council MCU14/0040.03 | 233 Maleny-Stanley River Rd Wootha | 11 Feb 2022 |
| Minor Change to approval and plans- Outdoor Sport, Recreation and Entertainment & Function Room - Maleny Botanical Gardens and Bird World - Covey Associates Pty Ltd - Sunshine Coast Regional Council MCU14/0040.02 | 233 Maleny-Stanley River Rd Wootha | 10 Sep 2020 |
| Generally In Accordance - Outdoor Sport, Recreation and Entertainment & Function Room - Covey Associates - Sunshine Coast Regional Council MCU14/0040.01 | 233 Maleny-Stanley River Rd Wootha | 31 Aug 2020 |
Planning Applications: Dwellings (1)
| Headline | Place | Date |
|---|---|---|
| Dwelling House - Terry Brennan - Adams and Sparkes Town Planning - Sunshine Coast Regional Council MCU20/0275 | 703 Maleny-Stanley River Rd Wootha | 29 Sep 2020 |
Median House Sale Prices by Street (100)
| Street | Date | Median sale value |
|---|---|---|
| Burnett Ln | 31 May 2024 | 4073000.0 |
| Maleny-Stanley River Rd | 31 May 2024 | 1267000.0 |
| Mountain View Rd | 31 May 2024 | 441100.0 |
| Scotts Rd | 31 May 2024 | 1394000.0 |
| Burnett Ln | 30 Jun 2024 | 1409000.0 |
Recent Rental House Listings (100)
| Address | Rent (per week) | Bedrooms | Bathrooms | Garage spaces | Date | Subdivisible into |
|---|---|---|---|---|---|---|
| 329 Maleny-stanley River Rd | $1,750 | 3 | 4 | 2 | 18 Oct 2024 | 0 |
| 329 Maleny-stanley River Rd | $1,750 | 5 | 4 | 2 | 18 Oct 2024 | 0 |
| 329 Maleny-stanley River Rd | $1,750 | 3 | 4 | 2 | 18 Oct 2024 | 0 |
| 329 Maleny-stanley River Rd | $1,750 | 3 | 4 | 2 | 18 Oct 2024 | 0 |
| 329 Maleny-stanley River Rd | $1,750 | 3 | 4 | 2 | 18 Oct 2024 | 0 |
Recently Sold Units (61)
| Address | Price | Bedrooms | Bathrooms | Garage spaces | Date sold | Sale Type |
|---|---|---|---|---|---|---|
| 5 Scotts Rd | Price Withheld | 4.0 | 2.0 | 10.0 | 10 Dec 2024 | On Market |
| 5 Scotts Rd | Price Withheld | 4.0 | 2.0 | 10.0 | 10 Dec 2024 | On Market |
| 5 Scotts Rd | Price Withheld | 4.0 | 2.0 | 10.0 | 10 Dec 2024 | On Market |
| 5 Scotts Rd | Price Withheld | 4.0 | 2.0 | 10.0 | 10 Dec 2024 | On Market |
| 5 Scotts Rd | Price Withheld | 4.0 | 2.0 | 10.0 | 10 Dec 2024 | On Market |
Loading entities ..