.png)
Profiles
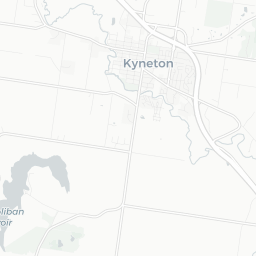
Nearby Suburbs
Real Estate Market: Is Rochford VIC 3442 a Good Suburb to Buy Into?
Housing Market in Rochford

Sources: Property Listings and Microburbs, 2002 - 2023
| Field | Value | VS Melbourne | Trend | |
|---|---|---|---|---|
| Premium | Premium | Premium | ||
| Premium | Premium | Premium | ||
| Premium | Premium | Premium | ||
| $551 | Bottom 40% |
|
||
| Premium | Premium | Premium |
Housing Supply in Rochford

The higher the supply score the more supply is on the market, both current and future.
Sources: ABS, GEOSPATIAL, Property Listings, PLANNING ALERTS and Microburbs, 2002 - 2023
Sources: ABS, GEOSPATIAL, Property Listings, PLANNING ALERTS and Microburbs, 2002 - 2023
Rochford
49.1%
Rochford
49.1%
Melbourne
28.8%
Melbourne
28.8%
| Field | Value | VS Melbourne | Trend | |
|---|---|---|---|---|
| 0 | Bottom 38% | Data for Jun 2025 | ||
| 11.8 | Top 14% | Data for Jul 2023 | ||
| Premium | Premium | Premium | ||
| Premium | Premium | Premium | ||
| Premium | Premium | Premium | ||
| Premium | Premium | Premium | ||
| 0 | Bottom 24% | Data for Mar 2025 |
Housing Stock Quality in Rochford
The higher the score, the higher the quality of the houses and units.
Sources: ABS, GEOSPATIAL, Property Listings and Microburbs, 2006 - 2023
Sources: ABS, GEOSPATIAL, Property Listings and Microburbs, 2006 - 2023
| Field | Value | VS Melbourne | Trend | |
|---|---|---|---|---|
| 100.0% | Top 31% | Data for Jan 2021 | ||
| 2.5 | Top 48% |
|
||
| 0.0% | Bottom 37% | Data for Jun 2023 |
Development Restrictions in Rochford

The higher the score, the more easily density can be increased.
Sources: GEOSPATIAL, TORREN and Microburbs, 2011 - 2023
Sources: GEOSPATIAL, TORREN and Microburbs, 2011 - 2023
Rochford
18.1%
Rochford
18.1%
Melbourne
36.9%
Melbourne
36.9%
| Field | Value | VS Melbourne | Trend | |
|---|---|---|---|---|
| 0.0 sq km | Bottom 49% | Data for Jun 2023 |
Risk in Rochford

The higher the score, the more exposed households are to financial stress.
Sources: ABS, Property Listings, TORREN and Microburbs, 2006 - 2023
Sources: ABS, Property Listings, TORREN and Microburbs, 2006 - 2023
Rochford
40.5%
Rochford
40.5%
Melbourne
60.4%
Melbourne
60.4%
| Field | Value | VS Melbourne | Trend | |
|---|---|---|---|---|
| 29 | Bottom 38% | Data for Jun 2023 | ||
| 87 | Top 6% | Data for Jun 2023 | ||
| 82 | Top 12% | Data for Jun 2023 | ||
| 27.0% | Top 25% |
|
Housing Demand in Rochford
The higher the score, the more demand their is for housing in the area, both current and future.
Sources: ABS, TORREN, Property Listings and Microburbs, 2006 - 2030
Sources: ABS, TORREN, Property Listings and Microburbs, 2006 - 2030
Rochford
44.8%
Rochford
44.8%
Melbourne
82.9%
Melbourne
82.9%
| Field | Value | VS Melbourne | Trend | |
|---|---|---|---|---|
| Premium | Premium | Premium | ||
| Premium | Premium | Premium | ||
| 14700 | Top 38% |
|
||
| 34300 | Bottom 19% |
|
||
| Premium | Premium | Premium | ||
| 58600 | Top 24% |
|
||
| Premium | Premium | Premium | ||
| Premium | Premium | Premium | ||
| Premium | Premium | Premium |
Unit Market in Rochford
Sources: Property Listings and Microburbs, 2002 - 2023
| Field | Value | VS Melbourne | Trend | |
|---|---|---|---|---|
| Premium | Premium | Premium | ||
| $453 | Top 32% |
|
||
| Premium | Premium | Premium | ||
| 226.0% | Top 1% |
|
Turnover Rate by Street (8)
| Turnover rate | Street | Turnover Label | Turnover Years | Year |
|---|---|---|---|---|
| 250.0% | Boundary Rd | very high turnover | Every 4.0 years (very high turnover) | 2025 |
| 55.6% | Rochford Rd | quite tightly held | Every 18.0 years (quite tightly held) | 2025 |
| 100.0% | Otts Ln | high turnover | Every 10.0 years (high turnover) | 2025 |
| 50.0% | Frankenburg Rd | very tightly held | Every 20.0 years (very tightly held) | 2025 |
| 100.0% | Government Rd | high turnover | Every 10.0 years (high turnover) | 2025 |
LGA Details (1)
| Headline | Place | Datetime |
|---|---|---|
| Local government area | Macedon Ranges |
Planning Applications: Dwellings (5)
| Headline | Place | Date |
|---|---|---|
| Use and development of the land for a second dwelling (Secondary consent sought to change dwelling from double storey to single storey) - Macedon Ranges Shire Council PLN/2018/519/C | 556 Boundary Road Rochford VIC 3442 | 11 Jun 2024 |
| Use and development of the land for the purpose of a single dwelling and an outbuilding ancillary to a dwelling and two 25,000 litre water tanks (Secondary consent sought for an alternative house design) - Macedon Ranges Shire Council PLN/2021/593/A | 700 Rochford Road Rochford VIC 3442 | 20 Dec 2023 |
| Use and development of the land for a second dwelling (Amendment sought to amend Condition 1a of Planning Permit to allow relocation of Dwelling) - Macedon Ranges Shire Council PLN/2018/519/B | 556 Boundary Road Rochford VIC 3442 | 22 Mar 2022 |
| Use and development of the land for the purpose of a dwelling - Macedon Ranges Shire Council PLN/2021/593 | 700 Rochford Road Rochford VIC 3442 | 15 Dec 2021 |
| Use and development of the land for a second dwelling (Secondary Consent sought to relocate dwelling) - Macedon Ranges Shire Council PLN/2018/519/A | 556 Boundary Road Rochford VIC 3442 | 15 Jul 2021 |
Recently Sold Houses (17)
| Address | Price | Bedrooms | Bathrooms | Garage spaces | Date sold | Subdivisible into | Sale Type |
|---|---|---|---|---|---|---|---|
| 51 Otts Ln | Price Withheld | 3.0 | 1.0 | 1.0 | 29 Nov 2023 | 0 | On Market |
| 45 Angle Rd | Price Withheld | 3.0 | 3.0 | 4.0 | 13 Dec 2022 | 0 | On Market |
| 641 Rochford Rd | $3,600,000 | 08 Oct 2022 | 0 | On Market | |||
| 488 Rochford Rd | $810,000 | 3.0 | 1.0 | 2.0 | 22 Dec 2021 | 0 | On Market |
| 488 Rochford Rd | $810,000 | 3.0 | 1.0 | 2.0 | 22 Dec 2021 | 0 | On Market |
Percent of Renters by Street (9)
| Percent of Renters | Street |
|---|---|
| 0.0% | Angle Rd |
| 0.0% | Boundary Rd |
| 0.0% | Cullys Rd |
| 0.0% | Frankenburg Rd |
| 0.0% | Government Rd |
Median House Sale Prices by Street (33)
| Street | Date | Median sale value |
|---|---|---|
| Angle Rd | 31 May 2024 | 986200.0 |
| Angle Rd | 30 Jun 2024 | 1513000.0 |
| Angle Rd | 30 Jun 2024 | 1522000.0 |
| Angle Rd | 31 Jul 2024 | 1515000.0 |
| Angle Rd | 31 Jul 2024 | 1490000.0 |
Recent Rental Unit Listings (100)
| Address | Rent (per week) | Bedrooms | Bathrooms | Garage spaces | Date |
|---|---|---|---|---|---|
| 767 Rochford Rd | $430 | 3.0 | 1.0 | 2.0 | 12 Jun 2021 |
| 767 Rochford Rd | $430 | 3.0 | 1.0 | 2.0 | 12 Jun 2021 |
| 767 Rochford Rd | $430 | 3.0 | 1.0 | 2.0 | 12 Jun 2021 |
| 767 Rochford Rd | $430 | 3.0 | 1.0 | 2.0 | 12 Jun 2021 |
| 767 Rochford Rd | $430 | 3.0 | 1.0 | 2.0 | 12 Jun 2021 |
Recent Rental House Listings (100)
| Address | Rent (per week) | Bedrooms | Bathrooms | Garage spaces | Date | Subdivisible into |
|---|---|---|---|---|---|---|
| 10 Monument Creek Rd | $470 | 3 | 1 | 2 | 06 Sep 2024 | 0 |
| 10 Monument Creek Rd | $470 | 3 | 1 | 2 | 06 Sep 2024 | 0 |
| 10 Monument Creek Rd | $470 | 3 | 1 | 2 | 06 Sep 2024 | 0 |
| 10 Monument Creek Rd | $470 | 3 | 1 | 2 | 06 Sep 2024 | 0 |
| 10 Monument Creek Rd | $470 | 3 | 1 | 2 | 06 Sep 2024 | 0 |
Recently Sold Units (100)
| Address | Price | Bedrooms | Bathrooms | Garage spaces | Date sold | Sale Type |
|---|---|---|---|---|---|---|
| 51 Otts Ln | Price Withheld | 3.0 | 1.0 | 1.0 | 29 Nov 2023 | On Market |
| 51 Otts Ln | Price Withheld | 3.0 | 1.0 | 1.0 | 29 Nov 2023 | On Market |
| 51 Otts Ln | Price Withheld | 3.0 | 1.0 | 1.0 | 29 Nov 2023 | On Market |
| 51 Otts Ln | Price Withheld | 3.0 | 1.0 | 1.0 | 29 Nov 2023 | On Market |
| 51 Otts Ln | Price Withheld | 3.0 | 1.0 | 1.0 | 29 Nov 2023 | On Market |
Loading entities ..