.png)
Profiles
Nearby Suburbs
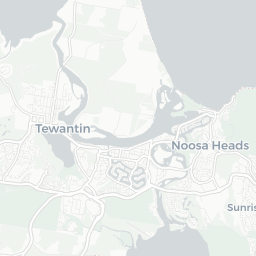
Real Estate Market: Is Tewantin QLD 4565 a Good Suburb to Buy Into?
Housing Market in Tewantin

Sources: Property Listings and Microburbs, 2002 - 2023
| Field | Value | VS Sunshine Coast | Trend | |
|---|---|---|---|---|
| Premium | Premium | Premium | ||
| Premium | Premium | Premium | ||
| Premium | Premium | Premium | ||
| $865 | Top 11% |
|
||
| Premium | Premium | Premium |
Housing Supply in Tewantin

The higher the supply score the more supply is on the market, both current and future.
Sources: ABS, GEOSPATIAL, Property Listings, PLANNING ALERTS and Microburbs, 2002 - 2023
Sources: ABS, GEOSPATIAL, Property Listings, PLANNING ALERTS and Microburbs, 2002 - 2023
Tewantin
30.5%
Tewantin
30.5%
Sunshine Coast
33.9%
Sunshine Coast
33.9%
| Field | Value | VS Sunshine Coast | Trend | |
|---|---|---|---|---|
| 302 | Top 12% |
|
||
| 0.4 | Bottom 26% | Data for Jul 2023 | ||
| 79.4 | Top 6% | Data for May 2023 | ||
| Premium | Premium | Premium | ||
| Premium | Premium | Premium | ||
| Premium | Premium | Premium | ||
| Premium | Premium | Premium | ||
| Premium | Premium | Premium | ||
| 28 | Top 3% |
|
Housing Stock Quality in Tewantin
The higher the score, the higher the quality of the houses and units.
Sources: ABS, GEOSPATIAL, Property Listings and Microburbs, 2006 - 2023
Sources: ABS, GEOSPATIAL, Property Listings and Microburbs, 2006 - 2023
| Field | Value | VS Sunshine Coast | Trend | |
|---|---|---|---|---|
| 83.1% | Bottom 14% |
|
||
| 2.3 | Bottom 34% | Data for Jan 2021 | ||
| 26.5% | Top 11% | Data for Jun 2023 |
Development Restrictions in Tewantin

The higher the score, the more easily density can be increased.
Sources: GEOSPATIAL, TORREN, ABS and Microburbs, 2011 - 2023
Sources: GEOSPATIAL, TORREN, ABS and Microburbs, 2011 - 2023
Tewantin
38.0%
Tewantin
38.0%
Sunshine Coast
41.2%
Sunshine Coast
41.2%
| Field | Value | VS Sunshine Coast | Trend | |
|---|---|---|---|---|
| 19.0 sq km | Top 36% | Data for Jan 2021 | ||
| 0.0 sq km | Bottom 39% | Data for Jun 2023 | ||
| 670 sqm per resident | Bottom 36% | Data for Jan 2021 |
Risk in Tewantin

The higher the score, the more exposed households are to financial stress.
Sources: ABS, Property Listings, TORREN and Microburbs, 2006 - 2023
Sources: ABS, Property Listings, TORREN and Microburbs, 2006 - 2023
Tewantin
52.5
Tewantin
52.5
Sunshine Coast
52.5
Sunshine Coast
52.5
| Field | Value | VS Sunshine Coast | Trend | |
|---|---|---|---|---|
| 84.2% | Bottom 25% |
|
||
| 15.8% | Top 25% |
|
||
| 68 | Top 4% | Data for Jun 2023 | ||
| $2,090 | Top 41% |
|
||
| 57 | Bottom 1% | Data for Jun 2023 | ||
| 45 | Bottom 0% | Data for Jun 2023 | ||
| 32.8% | Top 10% |
|
||
| 30.0% | Bottom 25% |
|
Housing Demand in Tewantin
The higher the score, the more demand their is for housing in the area, both current and future.
Sources: ABS, TORREN, Property Listings and Microburbs, 1975 - 2030
Sources: ABS, TORREN, Property Listings and Microburbs, 1975 - 2030
Tewantin
69.4%
Tewantin
69.4%
Sunshine Coast
80.6%
Sunshine Coast
80.6%
| Field | Value | VS Sunshine Coast | Trend | |
|---|---|---|---|---|
| Premium | Premium | Premium | ||
| Premium | Premium | Premium | ||
| 11500 | Top 37% |
|
||
| 48500 | Bottom 32% |
|
||
| Premium | Premium | Premium | ||
| 63300 | Top 22% |
|
||
| Premium | Premium | Premium | ||
| Premium | Premium | Premium | ||
| Premium | Premium | Premium | ||
| Premium | Premium | Premium |
Unit Market in Tewantin
Sources: Property Listings and Microburbs, 2002 - 2023
| Field | Value | VS Sunshine Coast | Trend | |
|---|---|---|---|---|
| Premium | Premium | Premium | ||
| Premium | Premium | Premium | ||
| Premium | Premium | Premium | ||
| $819 | Top 6% |
|
||
| Premium | Premium | Premium | ||
| 93.0% | Top 12% |
|
LGA Details (1)
| Headline | Place | Datetime |
|---|---|---|
| Local government area | Noosa |
Percent of Renters by Street (100)
| Percent of Renters | Street |
|---|---|
| 11.5% | Ada St |
| 34.4% | Agrippa Cr |
| 84.8% | Appleberry Ln |
| 38.2% | Ashford St |
| 6.8% | Avron Cl |
Median House Rental Prices by Street (41)
| Level_0 | Street | Date | Median rent (per week) |
|---|---|---|---|
| 140974 | George St | 11 Apr 2025 | $880 |
| 140980 | Gleneagles Dr | 11 Apr 2025 | $900 |
| 140964 | Furness Dr | 11 Apr 2025 | $880 |
| 140949 | Foedera Cr | 11 Apr 2025 | $745 |
| 141015 | Griffith Ave | 11 Apr 2025 | $875 |
Turnover Rate by Street (100)
| Turnover rate | Street | Turnover Label | Turnover Years | Year |
|---|---|---|---|---|
| 55.6% | Hilton Esp | quite tightly held | Every 18.0 years (quite tightly held) | 2025 |
| 69.0% | Cullinane St | average turnover | Every 14.5 years (average turnover) | 2025 |
| 92.2% | Doonella St | high turnover | Every 10.8 years (high turnover) | 2025 |
| 71.8% | Crank St | average turnover | Every 13.9 years (average turnover) | 2025 |
| 88.9% | Golf Course Dr | high turnover | Every 11.2 years (high turnover) | 2025 |
Realtors (6)
| Headline | Place | Datetime |
|---|---|---|
| Hang Loosa Property Noosa | 2 88 Poinciana Ave | |
| Maureen's Rental Properties | ||
| Robert James Realty | 1/ 84 Poinciana Ave | |
| Robert James Realty and Property Management | 1/84 Poinciana Ave | |
| Ray White Noosa River | Shop 8/113 Poinciana Ave |
Accommodation Options (6)
| Headline | Place | Datetime |
|---|---|---|
| Lake Cooroibah Holiday Park | Maximillian Rd | |
| Noosa Lakes Resort | 3 Hilton Terrace | |
Median Unit Sale Prices by Street (100)
| Date | Median sale value | Street |
|---|---|---|
| 10 May 2024 | $2,125,000 | Blakesley St |
| 10 May 2024 | $860,000 | Hilton Tce |
| 10 May 2024 | $850,000 | Doonella St |
| 10 May 2024 | $470,000 | Poinciana Ave |
| 10 May 2024 | $400,000 | Moorindil St |
Median House Sale Prices by Street (100)
| Street | Date | Median sale value |
|---|---|---|
| George St | 10 May 2024 | $1,408,000 |
| Hendry St | 10 May 2024 | $1,350,000 |
| Homestead Dr | 10 May 2024 | $951,000 |
| Hooper Cr | 10 May 2024 | $915,000 |
| Hilton Esp | 10 May 2024 | $4,875,000 |
Planning Applications: Other (78)
| Headline | Place | Date |
|---|---|---|
| Additions (enclosed), Alterations (internal), Carport, Private Pool - Noosa Shire Council PC25/0204 | 5 Bramble Pl Tewantin QLD 4565 | 08 Feb 2025 |
| Change from SSL to 4 x 60 Days - Noosa Shire Council SSL22/0080.01 | 1 Gumnut Ct Tewantin QLD 4565 | 17 Sep 2024 |
| Class 1a structure demolished / removed from site - Noosa Shire Council PC24/0015 | 14 Butler St Tewantin QLD 4565 | 19 Jan 2024 |
| Dwelling unit, Food and drink outlet, Multiple dwelling - Noosa Shire Council MCU23/0142 | 25 Sidoni St Tewantin QLD 4565 | 11 Nov 2023 |
| Class 1a structure demolished / removed from site - Noosa Shire Council PC23/1086 | 118 George St Tewantin QLD 4565 | 21 Sep 2023 |
Planning Applications: Dwellings (22)
| Headline | Place | Date |
|---|---|---|
| Dwelling unit, Food and drink outlet, Multiple dwelling - Noosa Shire Council MCU23/0142 | 25 Sidoni St Tewantin QLD 4565 | 11 Nov 2023 |
| Private Pool, Shed / Garage, Single Detached Dwelling - Noosa Shire Council PC23/1004 | 124 Moorindil St Tewantin QLD 4565 | 23 Aug 2023 |
| Residential care facility - Noosa Shire Council MCU22/0162 | 10 Carramar St Tewantin QLD 4565 | 13 Sep 2022 |
| Demolition Class 1 and 10 - Noosa Shire Council DBW22/0108 | 113 Moorindil St Tewantin QLD 4565 | 01 Aug 2022 |
| Demolition Class 1 and 10 - Noosa Shire Council DBW22/0067 | 121 Werin St Tewantin QLD 4565 | 17 May 2022 |
Businesses (54)
| Name | Address |
|---|---|
| Johnno's Fencing | 21 Feathertail Ct, Tewantin QLD 4565, Australia |
| Pete`s Fencing Tewantin | 4 Wentworth St, Tewantin QLD 4565, Australia |
| Blanchard Electrical | 4 Maple Ave, Tewantin QLD 4565, Australia |
| Buzz a Sparky | 19 Talara Ct, Tewantin QLD 4565, Australia |
| JCM Electrical | 32 Ward St, Tewantin QLD 4565, Australia |
Recently Sold Houses (100)
| Address | Price | Bedrooms | Bathrooms | Garage spaces | Date sold | Subdivisible into | Sale Type |
|---|---|---|---|---|---|---|---|
| 69 Hooper Cr | $1,360,000 | 3.0 | 2.0 | 6.0 | 10 Apr 2025 | 0 | On Market |
| Unit 25, 44 Tait St | $745,000 | 2.0 | 1.0 | 1.0 | 07 Apr 2025 | 0 | On Market |
| 4 Fyne Ct | $1,000,000 | 4.0 | 2.0 | 2.0 | 05 Apr 2025 | 0 | On Market |
| 2 Murdock Ct | $1,250,000 | 4.0 | 2.0 | 2.0 | 28 Mar 2025 | 0 | On Market |
| 33 Woolumba St | $1,060,000 | 4.0 | 2.0 | 5.0 | 18 Mar 2025 | 0 | On Market |
Recent Rental House Listings (100)
| Address | Rent (per week) | Bedrooms | Bathrooms | Garage spaces | Date | Subdivisible into |
|---|---|---|---|---|---|---|
| 8 Perkins Pl | $1,200 | 4 | 2 | 2 | 11 Apr 2025 | 0 |
| 24 George St | $88,092 | 3 | 2 | 2 | 04 Apr 2025 | 0 |
| 19 Lake View Dr | $1,300 | 4 | 3 | 2 | 28 Mar 2025 | 0 |
| 19 Lake View Dr | $1,300 | 4 | 3 | 2 | 28 Mar 2025 | 0 |
| 19 Lake View Dr | $1,300 | 4 | 3 | 2 | 28 Mar 2025 | 0 |
Recent Rental Unit Listings (100)
| Address | Rent (per week) | Bedrooms | Bathrooms | Garage spaces | Date |
|---|---|---|---|---|---|
| Unit 1, 8 Hilton Terrace | $650 | 2.0 | 1.0 | 1.0 | 11 Apr 2025 |
| Unit 26, 3 Hilton Terrace | $400 | 1.0 | 1.0 | 0.0 | 05 Mar 2025 |
| Unit 26, 3 Hilton Terrace | $400 | 1.0 | 1.0 | 0.0 | 05 Mar 2025 |
| Unit 26, 3 Hilton Terrace | $400 | 1.0 | 1.0 | 0.0 | 05 Mar 2025 |
| Unit 26, 3 Hilton Terrace | $400 | 1.0 | 1.0 | 0.0 | 05 Mar 2025 |
Recently Sold Units (100)
| Address | Price | Bedrooms | Bathrooms | Garage spaces | Date sold | Sale Type |
|---|---|---|---|---|---|---|
| Unit 3, 16 Hilton Terrace | Price Withheld | 2.0 | 2.0 | 1.0 | 06 Apr 2025 | On Market |
| Unit 3, 16 Hilton Terrace | Price Withheld | 2.0 | 2.0 | 1.0 | 06 Apr 2025 | On Market |
| Unit 3, 16 Hilton Terrace | Price Withheld | 2.0 | 2.0 | 1.0 | 06 Apr 2025 | On Market |
| Unit 72, 139 Moorindil St | $360,000 | 1.0 | 1.0 | 0.0 | 14 Feb 2025 | On Market |
| Unit 72, 139 Moorindil St | Price Withheld | 1.0 | 1.0 | 0.0 | 14 Feb 2025 | On Market |
Loading entities ..