.png)
Profiles
Nearby Suburbs
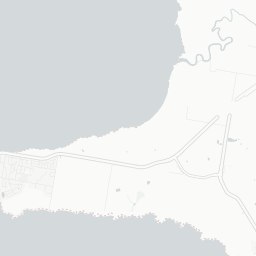
Real Estate Market: Is Bass VIC 3991 a Good Suburb to Buy Into?
Housing Market in Bass

Sources: Property Listings and Microburbs, 2002 - 2023
| Field | Value | VS Latrobe | Trend | |
|---|---|---|---|---|
| Premium | Premium | Premium | ||
| Premium | Premium | Premium | ||
| Premium | Premium | Premium | ||
| $520 | Bottom 31% |
|
||
| Premium | Premium | Premium |
Housing Supply in Bass

The higher the supply score the more supply is on the market, both current and future.
Sources: ABS, GEOSPATIAL, Property Listings, PLANNING ALERTS and Microburbs, 2002 - 2023
Sources: ABS, GEOSPATIAL, Property Listings, PLANNING ALERTS and Microburbs, 2002 - 2023
Bass
39.4%
Bass
39.4%
Latrobe
33.6%
Latrobe
33.6%
| Field | Value | VS Latrobe | Trend | |
|---|---|---|---|---|
| 0 | Bottom 38% | Data for Jun 2025 | ||
| 1.0 | Bottom 33% | Data for Jul 2023 | ||
| Premium | Premium | Premium | ||
| Premium | Premium | Premium | ||
| Premium | Premium | Premium | ||
| 4 lots | Bottom 38% |
|
||
| Premium | Premium | Premium | ||
| Premium | Premium | Premium | ||
| 6 | Top 22% |
|
Housing Stock Quality in Bass
The higher the score, the higher the quality of the houses and units.
Sources: ABS, GEOSPATIAL, Property Listings and Microburbs, 2006 - 2023
Sources: ABS, GEOSPATIAL, Property Listings and Microburbs, 2006 - 2023
| Field | Value | VS Latrobe | Trend | |
|---|---|---|---|---|
| 100.0% | Top 31% |
|
||
| 2.4 | Bottom 42% |
|
||
| 0.0% | Bottom 37% | Data for Jun 2023 |
Development Restrictions in Bass

The higher the score, the more easily density can be increased.
Sources: GEOSPATIAL, TORREN, ABS and Microburbs, 2011 - 2023
Sources: GEOSPATIAL, TORREN, ABS and Microburbs, 2011 - 2023
Bass
19.6%
Bass
19.6%
Latrobe
30.6%
Latrobe
30.6%
| Field | Value | VS Latrobe | Trend | |
|---|---|---|---|---|
| 64.0 sq km | Top 18% | Data for Jan 2021 | ||
| 0.0 sq km | Top 43% | Data for Jun 2023 | ||
| 3470 sqm per resident | Top 31% | Data for Jan 2021 |
Risk in Bass

The higher the score, the more exposed households are to financial stress.
Sources: ABS, Property Listings, TORREN and Microburbs, 2006 - 2023
Sources: ABS, Property Listings, TORREN and Microburbs, 2006 - 2023
Bass
45.3
Bass
45.3
Latrobe
36.1
Latrobe
36.1
| Field | Value | VS Latrobe | Trend | |
|---|---|---|---|---|
| 89.8% | Bottom 41% |
|
||
| 10.3% | Top 41% |
|
||
| 54 | Top 10% | Data for Jun 2023 | ||
| $2,210 | Top 34% |
|
||
| 73 | Bottom 20% | Data for Jun 2023 | ||
| 62 | Bottom 6% | Data for Jun 2023 | ||
| 27.3% | Top 24% |
|
||
| 48.2% | Top 25% |
|
Housing Demand in Bass
The higher the score, the more demand their is for housing in the area, both current and future.
Sources: ABS, TORREN, Property Listings and Microburbs, 2006 - 2030
Sources: ABS, TORREN, Property Listings and Microburbs, 2006 - 2030
Bass
47.2%
Bass
47.2%
Latrobe
55.8%
Latrobe
55.8%
| Field | Value | VS Latrobe | Trend | |
|---|---|---|---|---|
| Premium | Premium | Premium | ||
| Premium | Premium | Premium | ||
| 34000 | Top 2% |
|
||
| 73700 | Top 42% |
|
||
| Premium | Premium | Premium | ||
| 43000 | Top 29% |
|
||
| Premium | Premium | Premium | ||
| Premium | Premium | Premium | ||
| Premium | Premium | Premium |
Unit Market in Bass
Sources: Property Listings and Microburbs, 2002 - 2023
| Field | Value | VS Latrobe | Trend | |
|---|---|---|---|---|
| Premium | Premium | Premium | ||
| $330 | Bottom 7% |
|
||
| Premium | Premium | Premium | ||
| 99.5% | Top 16% | 0 to Feb 2025 |
Planning Applications: Other (1)
| Headline | Place | Date |
|---|---|---|
| Restaurant and cafe Licence for a Company - Victorian Commission for Gambling and Liquor Regulation 71060A01 | 296 Agar Rd, Bass 3991, VIC | 17 Feb 2022 |
Businesses (11)
| Name | Address |
|---|---|
| SR Excavations | 69 Hade Ave, Bass VIC 3991, Australia |
| SR Excavations | 69, Hade Avenue Road |
| MJK Stairs | Woolmer Rd |
| Bass Glass | 82, Agar Rd |
| SR Excavations | 69, Hade Avenue Road |
Accommodation Options (2)
| Name | Address |
|---|---|
| Tompsett Towers | 6, Bass Rd |
Turnover Rate by Street (27)
| Turnover rate | Street | Turnover Label | Turnover Years | Year |
|---|---|---|---|---|
| 125.8% | Hade Ave | very high turnover | Every 7.9 years (very high turnover) | 2025 |
| 246.7% | Reid Ln | very high turnover | Every 4.1 years (very high turnover) | 2025 |
| 100.0% | Bass Hwy | high turnover | Every 10.0 years (high turnover) | 2025 |
| 300.0% | Withers Ln | very high turnover | Every 3.3 years (very high turnover) | 2025 |
| 25.0% | Agar Rd | very tightly held | Every 40.0 years (very tightly held) | 2025 |
Percent of Renters by Street (28)
| Percent of Renters | Street |
|---|---|
| 0.0% | Mapleson Rd |
| 0.0% | Acton Rd |
| 0.0% | Agar Rd |
| 7.8% | Bass Hwy |
| 0.0% | Bass Landing Rd |
LGA Details (1)
| Headline | Place | Datetime |
|---|---|---|
| Local government area | Bass Coast |
Recently Sold Houses (97)
| Address | Price | Bedrooms | Bathrooms | Garage spaces | Date sold | Subdivisible into | Sale Type |
|---|---|---|---|---|---|---|---|
| 7 Bass School Rd | $475,000 | 3.0 | 1.0 | 6.0 | 11 Mar 2025 | 0 | On Market |
| 20-22 Hade Ave | Price Withheld | 0.0 | 0.0 | 0.0 | 17 Jan 2025 | 0 | On Market |
| 19 Pender Rd | Price Withheld | 6.0 | 4.0 | 10.0 | 16 Jan 2025 | 0 | On Market |
| 190 Soldiers Rd | $1,550,000 | 4.0 | 2.0 | 6.0 | 03 Dec 2024 | 0 | On Market |
| 56 Bass Rd | $830,000 | 5.0 | 2.0 | 2.0 | 18 Sep 2024 | 0 | On Market |
Median House Sale Prices by Street (100)
| Street | Date | Median sale value |
|---|---|---|
| Bass Landing Rd | 30 Jun 2024 | 1244000.0 |
| Withers Ln | 10 Apr 2024 | $965,000 |
| Bass Rd | 06 Oct 2023 | $750,000 |
| Bass Hwy | 06 Oct 2023 | $908,200 |
| Bass School Rd | 06 Oct 2023 | $340,000 |
Recent Rental House Listings (100)
| Address | Rent (per week) | Bedrooms | Bathrooms | Garage spaces | Date | Subdivisible into |
|---|---|---|---|---|---|---|
| 70 Nolan Rd | $480 | 4 | 2 | 2 | 15 Oct 2024 | 0 |
| 70 Nolan Rd | $480 | 4 | 2 | 2 | 15 Oct 2024 | 0 |
| 70 Nolan Rd | $480 | 4 | 2 | 2 | 15 Oct 2024 | 0 |
| 70 Nolan Rd | $480 | 4 | 2 | 2 | 15 Oct 2024 | 0 |
| 70 Nolan Rd | $480 | 4 | 2 | 2 | 15 Oct 2024 | 0 |
Recently Sold Units (100)
| Address | Price | Bedrooms | Bathrooms | Garage spaces | Date sold | Sale Type |
|---|---|---|---|---|---|---|
| 20-22 Hade Ave | Price Withheld | 0.0 | 0.0 | 0.0 | 17 Jan 2025 | On Market |
| 20-22 Hade Ave | Price Withheld | 0.0 | 0.0 | 0.0 | 17 Jan 2025 | On Market |
| 20-22 Hade Ave | Price Withheld | 0.0 | 0.0 | 0.0 | 17 Jan 2025 | On Market |
| 20-22 Hade Ave | Price Withheld | 0.0 | 0.0 | 0.0 | 17 Jan 2025 | On Market |
| 190 Soldiers Rd | $1,550,000 | 4.0 | 2.0 | 6.0 | 03 Dec 2024 | On Market |
Loading entities ..