.png)
Profiles
Nearby Suburbs
Real Estate Market: Is Coronet Bay VIC 3984 a Good Suburb to Buy Into?
Housing Market in Coronet Bay

Sources: Property Listings and Microburbs, 2002 - 2023
| Field | Value | VS Latrobe | Trend | |
|---|---|---|---|---|
| Premium | Premium | Premium | ||
| Premium | Premium | Premium | ||
| Premium | Premium | Premium | ||
| $520 | Bottom 31% |
|
||
| Premium | Premium | Premium |
Housing Supply in Coronet Bay

The higher the supply score the more supply is on the market, both current and future.
Sources: ABS, GEOSPATIAL, Property Listings, PLANNING ALERTS and Microburbs, 2002 - 2023
Sources: ABS, GEOSPATIAL, Property Listings, PLANNING ALERTS and Microburbs, 2002 - 2023
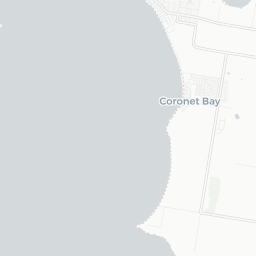
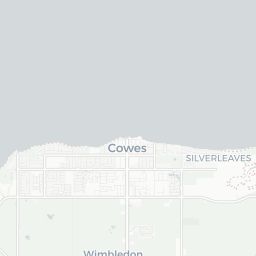
Coronet Bay
37.3%
Coronet Bay
37.3%
Latrobe
33.6%
Latrobe
33.6%
| Field | Value | VS Latrobe | Trend | |
|---|---|---|---|---|
| 0 | Bottom 38% |
|
||
| 0.4 | Bottom 26% | Data for Jul 2023 | ||
| 43.3 | Top 16% | Data for May 2023 | ||
| Premium | Premium | Premium | ||
| Premium | Premium | Premium | ||
| Premium | Premium | Premium | ||
| 2 lots | Bottom 22% | Data for Oct 2022 | ||
| Premium | Premium | Premium | ||
| Premium | Premium | Premium | ||
| 15 | Top 11% |
|
Housing Stock Quality in Coronet Bay
The higher the score, the higher the quality of the houses and units.
Sources: ABS, GEOSPATIAL, Property Listings and Microburbs, 2006 - 2023
Sources: ABS, GEOSPATIAL, Property Listings and Microburbs, 2006 - 2023
| Field | Value | VS Latrobe | Trend | |
|---|---|---|---|---|
| 99.4% | Bottom 37% | 0 to Jan 2021 | ||
| 2.0 | Bottom 15% |
|
||
| 31.6% | Top 10% | Data for Jun 2023 |
Development Restrictions in Coronet Bay

The higher the score, the more easily density can be increased.
Sources: GEOSPATIAL, TORREN, ABS and Microburbs, 2011 - 2023
Sources: GEOSPATIAL, TORREN, ABS and Microburbs, 2011 - 2023
Coronet Bay
23.5%
Coronet Bay
23.5%
Latrobe
30.6%
Latrobe
30.6%
| Field | Value | VS Latrobe | Trend | |
|---|---|---|---|---|
| 4.1 sq km | Bottom 37% | Data for Jan 2021 | ||
| 0.0 sq km | Bottom 43% | Data for Jun 2023 | ||
| 1480 sqm per resident | Top 47% | Data for Jan 2021 |
Risk in Coronet Bay

The higher the score, the more exposed households are to financial stress.
Sources: ABS, Property Listings, TORREN and Microburbs, 2006 - 2023
Sources: ABS, Property Listings, TORREN and Microburbs, 2006 - 2023
Coronet Bay
45.3
Coronet Bay
45.3
Latrobe
36.1
Latrobe
36.1
| Field | Value | VS Latrobe | Trend | |
|---|---|---|---|---|
| 87.4% | Bottom 34% |
|
||
| 12.6% | Top 34% |
|
||
| 36 | Top 40% | Data for Jun 2023 | ||
| $1,820 | Bottom 43% |
|
||
| 80 | Top 39% | Data for Jun 2023 | ||
| 74 | Bottom 39% | Data for Jun 2023 | ||
| 31.4% | Top 13% |
|
||
| 39.7% | Top 46% |
|
Housing Demand in Coronet Bay
The higher the score, the more demand their is for housing in the area, both current and future.
Sources: ABS, TORREN, Property Listings and Microburbs, 2004 - 2030
Sources: ABS, TORREN, Property Listings and Microburbs, 2004 - 2030
Coronet Bay
50.1%
Coronet Bay
50.1%
Latrobe
55.8%
Latrobe
55.8%
| Field | Value | VS Latrobe | Trend | |
|---|---|---|---|---|
| Premium | Premium | Premium | ||
| Premium | Premium | Premium | ||
| 34000 | Top 2% |
|
||
| 73700 | Top 42% |
|
||
| Premium | Premium | Premium | ||
| 43000 | Top 29% |
|
||
| Premium | Premium | Premium | ||
| Premium | Premium | Premium | ||
| Premium | Premium | Premium | ||
| Premium | Premium | Premium |
Unit Market in Coronet Bay
Sources: Property Listings and Microburbs, 2002 - 2023
| Field | Value | VS Latrobe | Trend | |
|---|---|---|---|---|
| Premium | Premium | Premium | ||
| 93.5% | Top 21% |
|
LGA Details (1)
| Headline | Place | Datetime |
|---|---|---|
| Local government area | Bass Coast |
Median House Rental Prices by Street (10)
| Level_0 | Street | Date | Median rent (per week) |
|---|---|---|---|
| 106330 | Gellibrand St | 13 Mar 2025 | $410 |
| 106078 | Agar Rd | 13 Mar 2025 | $415 |
| 106242 | Cutty Sark Rd | 13 Mar 2025 | $450 |
| 106668 | Shenandoah Dr | 13 Mar 2025 | $475 |
| 106661 | Semaphore St | 13 Mar 2025 | $450 |
Percent of Renters by Street (36)
| Percent of Renters | Street |
|---|---|
| 8.8% | Agar Rd |
| 19.2% | Bantering Bay Rd |
| 0.0% | Barrallier Rise |
| 21.9% | Bass Horizon Prom |
| 25.0% | Ben-Tor Tce |
Turnover Rate by Street (32)
| Turnover rate | Street | Turnover Label | Turnover Years | Year |
|---|---|---|---|---|
| 78.0% | Norsemens Rd | average turnover | Every 12.8 years (average turnover) | 2025 |
| 100.0% | Shenandoah Dr | high turnover | Every 10.0 years (high turnover) | 2025 |
| 70.3% | Lorna Doone Dr | average turnover | Every 14.2 years (average turnover) | 2025 |
| 80.0% | Bantering Bay Rd | average turnover | Every 12.5 years (average turnover) | 2025 |
| 109.1% | Bermuda Bend | very high turnover | Every 9.2 years (very high turnover) | 2025 |
Median House Sale Prices by Street (100)
| Street | Date | Median sale value |
|---|---|---|
| Ensign St | 10 May 2024 | $630,000 |
| Norsemens Rd | 10 May 2024 | $500,000 |
| Greenwich Gra | 10 May 2024 | $565,000 |
| Gellibrand St | 10 May 2024 | $595,000 |
| Corinella Rd | 10 May 2024 | $575,000 |
Planning Applications: Dwellings (1)
| Headline | Place | Date |
|---|---|---|
| Our clients own lots 42 and 43 on LP56633. At present, lot 42 contains a dwelling and carport. The boundary's realignment proposes moving the boundary 2.2m to the west to increase the space existing between the dwelling and the shared boundary. At present, lot 42 is 534m2 in area, and lot 43 is 530m2 in area. Lot 42 will increase to 601m2 in area following the realignment, and lot 43 will be reduced to 462m2. This change in area is less than 15%, and we believe the application meets the provision of VicSmart. - Streamlined Planning through Electronic Applications and Referrals S191502T | 79 Cutty Sark Road, Coronet Bay VIC 3984 | 21 Mar 2022 |
Planning Applications: Other (3)
| Headline | Place | Date |
|---|---|---|
| App.Online - Transfer of licence to Company - Victorian Commission for Gambling and Liquor Regulation 16576A11 | Cnr Cutty Sark Road &, Champs Elysees Esplanade, Coronet Bay 3984, VIC | 18 Feb 2022 |
| Certification of a Plan - Streamlined Planning through Electronic Applications and Referrals S164212V | 99 Cutty Sark Road, Coronet Bay VIC 3984 | 15 Sep 2020 |
| Certification of a Plan - Streamlined Planning through Electronic Applications and Referrals S158153S | 386 Agar Road, Coronet Bay VIC 3984 | 14 May 2020 |
Median Unit Sale Prices by Street (4)
| Date | Median sale value | Street |
|---|---|---|
| 10 May 2024 | $751,000 | Westaway St |
| 10 May 2024 | $324,500 | Carpathia St |
| 25 Apr 2024 | $589,100 | Marline Ct |
| 31 May 2024 | 1384000.0 | Bass Horizon Prom |
Recently Sold Houses (100)
| Address | Price | Bedrooms | Bathrooms | Garage spaces | Date sold | Subdivisible into | Sale Type |
|---|---|---|---|---|---|---|---|
| 23 Greenwich Grange | $640,000 | 4.0 | 2.0 | 2.0 | 10 Mar 2025 | 0 | On Market |
| 13 Bowline Ct | Price Withheld | 4.0 | 2.0 | 2.0 | 19 Feb 2025 | 0 | On Market |
| 41 Colonnades Circuit | Price Withheld | 5.0 | 2.0 | 2.0 | 19 Feb 2025 | 0 | On Market |
| 20 Oceanaires Ave | $550,000 | 3.0 | 1.0 | 3.0 | 15 Feb 2025 | 0 | On Market |
| 19 Lorna Doone Dr | Price Withheld | 3.0 | 1.0 | 2.0 | 14 Feb 2025 | 0 | On Market |
Recent Rental House Listings (100)
| Address | Rent (per week) | Bedrooms | Bathrooms | Garage spaces | Date | Subdivisible into |
|---|---|---|---|---|---|---|
| 11 Shenandoah Dr | $400 | 2 | 1 | 1 | 10 Mar 2025 | 0 |
| 11 Shenandoah Dr | $400 | 2 | 1 | 1 | 10 Mar 2025 | 0 |
| 28 Semaphore St | $550 | 4 | 2 | 4 | 03 Mar 2025 | 0 |
| 28 Semaphore St | $550 | 4 | 2 | 4 | 03 Mar 2025 | 0 |
| 28 Semaphore St | $550 | 4 | 2 | 4 | 03 Mar 2025 | 0 |
Recent Rental Unit Listings (100)
| Address | Rent (per week) | Bedrooms | Bathrooms | Garage spaces | Date |
|---|---|---|---|---|---|
| 33 Lorna Doone Dr | $350 | 2.0 | 1.0 | 2.0 | 21 Oct 2023 |
| 33 Lorna Doone Dr | $350 | 2.0 | 1.0 | 2.0 | 21 Oct 2023 |
| 33 Lorna Doone Dr | $350 | 2.0 | 1.0 | 2.0 | 21 Oct 2023 |
| 33 Lorna Doone Dr | $350 | 2.0 | 1.0 | 2.0 | 21 Oct 2023 |
| 33 Lorna Doone Dr | $350 | 2.0 | 1.0 | 2.0 | 21 Oct 2023 |
Recently Sold Units (100)
| Address | Price | Bedrooms | Bathrooms | Garage spaces | Date sold | Sale Type |
|---|---|---|---|---|---|---|
| 3 Marline Ct | $285,000 | 0.0 | 0.0 | 0.0 | 28 Jan 2025 | On Market |
| 3 Marline Ct | $285,000 | 0.0 | 0.0 | 0.0 | 28 Jan 2025 | On Market |
| 3 Marline Ct | $285,000 | 0.0 | 0.0 | 0.0 | 28 Jan 2025 | On Market |
| 104 Champ Elysees Esp | Price Withheld | 0.0 | 0.0 | 0.0 | 28 Oct 2024 | On Market |
| 104 Champ Elysees Esp | Price Withheld | 0.0 | 0.0 | 0.0 | 28 Oct 2024 | On Market |
Loading entities ..