.png)
Profiles
Nearby Suburbs
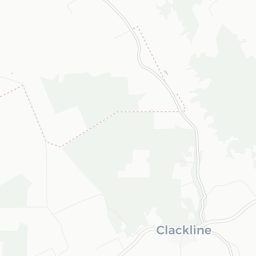
Real Estate Market: Is Clackline WA 6564 a Good Suburb to Buy Into?
Housing Market in Clackline

Sources: Property Listings and Microburbs, 2002 - 2023
| Field | Value | VS Regional WA | Trend | |
|---|---|---|---|---|
| Premium | Premium | Premium | ||
| Premium | Premium | Premium | ||
| Premium | Premium | Premium | ||
| $503 | Bottom 21% |
|
||
| Premium | Premium | Premium |
Housing Supply in Clackline

The higher the supply score the more supply is on the market, both current and future.
Sources: ABS, GEOSPATIAL, Property Listings and Microburbs, 2002 - 2023
Sources: ABS, GEOSPATIAL, Property Listings and Microburbs, 2002 - 2023
Clackline
53.8%
Clackline
53.8%
Regional WA
53.5%
Regional WA
53.5%
| Field | Value | VS Regional WA | Trend | |
|---|---|---|---|---|
| 0 | Bottom 38% | Data for Jun 2025 | ||
| 2.2 | Bottom 49% | Data for Jul 2023 | ||
| Premium | Premium | Premium | ||
| Premium | Premium | Premium | ||
| Premium | Premium | Premium | ||
| Premium | Premium | Premium | ||
| Premium | Premium | Premium | ||
| 2 | Top 33% |
|
Housing Stock Quality in Clackline
The higher the score, the higher the quality of the houses and units.
Sources: ABS, GEOSPATIAL, Property Listings and Microburbs, 2006 - 2023
Sources: ABS, GEOSPATIAL, Property Listings and Microburbs, 2006 - 2023
| Field | Value | VS Regional WA | Trend | |
|---|---|---|---|---|
| 100.0% | Top 31% | Data for Jan 2021 | ||
| 2.3 | Bottom 34% | Data for Jan 2021 | ||
| 0.0% | Bottom 37% | Data for Jun 2023 |
Development Restrictions in Clackline

The higher the score, the more easily density can be increased.
Sources: GEOSPATIAL, TORREN, ABS and Microburbs, 2011 - 2023
Sources: GEOSPATIAL, TORREN, ABS and Microburbs, 2011 - 2023
Clackline
23.2%
Clackline
23.2%
Regional WA
28.5%
Regional WA
28.5%
| Field | Value | VS Regional WA | Trend | |
|---|---|---|---|---|
| 48.0 sq km | Top 22% | Data for Jan 2021 | ||
| 47000 sqm per resident | Top 6% | Data for Jan 2021 |
Risk in Clackline

The higher the score, the more exposed households are to financial stress.
Sources: ABS, Property Listings, TORREN and Microburbs, 2006 - 2023
Sources: ABS, Property Listings, TORREN and Microburbs, 2006 - 2023
Clackline
37.0
Clackline
37.0
Regional WA
31.5
Regional WA
31.5
| Field | Value | VS Regional WA | Trend | |
|---|---|---|---|---|
| 100.0% | Top 11% | Data for May 2023 | ||
| 0.0% | Bottom 11% | Data for May 2023 | ||
| 18 | Bottom 5% | Data for Jun 2023 | ||
| $1,480 | Bottom 27% |
|
||
| 87 | Top 5% | Data for Jun 2023 | ||
| 86 | Top 2% | Data for Jun 2023 | ||
| 25.9% | Top 30% |
|
||
| 48.5% | Top 25% |
|
Housing Demand in Clackline
The higher the score, the more demand their is for housing in the area, both current and future.
Sources: ABS, TORREN, Property Listings and Microburbs, 2006 - 2030
Sources: ABS, TORREN, Property Listings and Microburbs, 2006 - 2030
Clackline
30.7%
Clackline
30.7%
Regional WA
40.5%
Regional WA
40.5%
| Field | Value | VS Regional WA | Trend | |
|---|---|---|---|---|
| Premium | Premium | Premium | ||
| Premium | Premium | Premium | ||
| 10900 | Bottom 46% |
|
||
| 59500 | Bottom 44% |
|
||
| Premium | Premium | Premium | ||
| 11600 | Bottom 46% |
|
||
| Premium | Premium | Premium | ||
| Premium | Premium | Premium |
Unit Market in Clackline
Sources: Property Listings and Microburbs, 2002 - 2023
| Field | Value | VS Regional WA | Trend | |
|---|---|---|---|---|
| Premium | Premium | Premium | ||
| $271 | Bottom 1% |
|
||
| Premium | Premium | Premium | ||
| 65.0% | Bottom 33% |
|
Recently Sold Houses (66)
| Address | Price | Bedrooms | Bathrooms | Garage spaces | Date sold | Subdivisible into | Sale Type |
|---|---|---|---|---|---|---|---|
| 199 Benrua Rd | $600,000 | 2.0 | 1.0 | 0.0 | 07 Apr 2025 | 0 | On Market |
| 80 Benrua Rd | $686,000 | 3.0 | 1.0 | 2.0 | 23 Dec 2024 | 0 | On Market |
| 80 Benrua Rd | Price Withheld | 3.0 | 1.0 | 2.0 | 23 Dec 2024 | 0 | On Market |
| 14 Dyer St | Price Withheld | 3.0 | 3.0 | 19 Nov 2024 | 0 | On Market | |
| 14 Dyer St | $640,000 | 3.0 | 3.0 | 19 Nov 2024 | 0 | On Market |
Businesses (1)
| Name | Address |
|---|---|
| Avw Electrical | Benrua Rd |
LGA Details (1)
| Headline | Place | Datetime |
|---|---|---|
| Local government area | Northam |
Percent of Renters by Street (24)
| Percent of Renters | Street |
|---|---|
| 0.0% | Connor Rd |
| 9.4% | Benrua Rd |
| 0.0% | Breen Rise |
| 56.9% | Clackline Rd |
| 0.0% | Clackline-Toodyay Rd |
Turnover Rate by Street (20)
| Turnover rate | Street | Turnover Label | Turnover Years | Year |
|---|---|---|---|---|
| 133.3% | Railway Rd | very high turnover | Every 7.5 years (very high turnover) | 2025 |
| 87.5% | Refractory Rd | high turnover | Every 11.4 years (high turnover) | 2025 |
| 150.0% | Eadine Rd | very high turnover | Every 6.7 years (very high turnover) | 2025 |
| 100.0% | Virginia Ct | high turnover | Every 10.0 years (high turnover) | 2025 |
| 11.1% | Raymond Ct | very tightly held | Every 90.0 years (very tightly held) | 2025 |
Median House Sale Prices by Street (100)
| Street | Date | Median sale value |
|---|---|---|
| Benrua Rd | 31 Jul 2024 | 2657000.0 |
| Benrua Rd | 10 May 2024 | $737,500 |
| Railway Rd | 31 May 2024 | 273900.0 |
| Refractory Rd | 31 May 2024 | 318100.0 |
| Virginia Ct | 31 May 2024 | 384400.0 |
Recent Rental House Listings (100)
| Address | Rent (per week) | Bedrooms | Bathrooms | Garage spaces | Date | Subdivisible into |
|---|---|---|---|---|---|---|
| 38 Lukin Rd | $650 | 4 | 2 | 2 | 17 Mar 2025 | 0 |
| 38 Lukin Rd | $650 | 4 | 2 | 2 | 17 Mar 2025 | 0 |
| 38 Lukin Rd | $650 | 4 | 2 | 2 | 17 Mar 2025 | 0 |
| 38 Lukin Rd | $650 | 4 | 2 | 2 | 17 Mar 2025 | 0 |
| 38 Lukin Rd | $650 | 4 | 2 | 2 | 17 Mar 2025 | 0 |
Recently Sold Units (100)
| Address | Price | Bedrooms | Bathrooms | Garage spaces | Date sold | Sale Type |
|---|---|---|---|---|---|---|
| 245 Railway Rd | $640,000 | 3.0 | 2.0 | 0.0 | 04 Jun 2024 | On Market |
| 245 Railway Rd | $640,000 | 3.0 | 2.0 | 0.0 | 04 Jun 2024 | On Market |
| 245 Railway Rd | $640,000 | 3.0 | 2.0 | 0.0 | 04 Jun 2024 | On Market |
| 245 Railway Rd | $640,000 | 3.0 | 2.0 | 0.0 | 04 Jun 2024 | On Market |
| 245 Railway Rd | $640,000 | 3.0 | 2.0 | 0.0 | 04 Jun 2024 | On Market |
Loading entities ..