.png)
Profiles
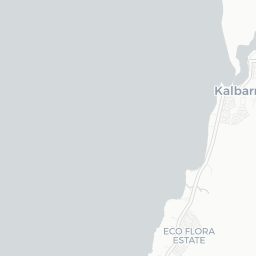
Nearby Suburbs
Real Estate Market: Is Kalbarri WA 6536 a Good Suburb to Buy Into?
Housing Market in Kalbarri

Sources: Property Listings and Microburbs, 2002 - 2023
| Field | Value | VS Regional WA | Trend | |
|---|---|---|---|---|
| Premium | Premium | Premium | ||
| Premium | Premium | Premium | ||
| Premium | Premium | Premium | ||
| $291 | Bottom 6% |
|
||
| Premium | Premium | Premium |
Housing Supply in Kalbarri

The higher the supply score the more supply is on the market, both current and future.
Sources: ABS, GEOSPATIAL, Property Listings and Microburbs, 2002 - 2023
Sources: ABS, GEOSPATIAL, Property Listings and Microburbs, 2002 - 2023
Kalbarri
55.4%
Kalbarri
55.4%
Regional WA
53.5%
Regional WA
53.5%
| Field | Value | VS Regional WA | Trend | |
|---|---|---|---|---|
| 0 | Bottom 38% | Data for Jun 2025 | ||
| 2.0 | Bottom 44% | Data for Jul 2023 | ||
| 10.1 | Top 26% | Data for May 2023 | ||
| Premium | Premium | Premium | ||
| Premium | Premium | Premium | ||
| Premium | Premium | Premium | ||
| Premium | Premium | Premium | ||
| Premium | Premium | Premium | ||
| 10 | Top 15% |
|
Housing Stock Quality in Kalbarri
The higher the score, the higher the quality of the houses and units.
Sources: ABS, GEOSPATIAL, Property Listings and Microburbs, 2006 - 2023
Sources: ABS, GEOSPATIAL, Property Listings and Microburbs, 2006 - 2023
| Field | Value | VS Regional WA | Trend | |
|---|---|---|---|---|
| 81.8% | Bottom 13% |
|
||
| 2.1 | Bottom 20% |
|
||
| 1.7% | Top 20% | Data for Jun 2023 |
Development Restrictions in Kalbarri

The higher the score, the more easily density can be increased.
Sources: GEOSPATIAL, TORREN, ABS and Microburbs, 2011 - 2023
Sources: GEOSPATIAL, TORREN, ABS and Microburbs, 2011 - 2023
Kalbarri
25.7%
Kalbarri
25.7%
Regional WA
28.5%
Regional WA
28.5%
| Field | Value | VS Regional WA | Trend | |
|---|---|---|---|---|
| 50.0 sq km | Top 21% | Data for Jan 2021 | ||
| 2440 sqm per resident | Top 37% | Data for Jan 2021 |
Risk in Kalbarri

The higher the score, the more exposed households are to financial stress.
Sources: ABS, Property Listings, TORREN and Microburbs, 2006 - 2023
Sources: ABS, Property Listings, TORREN and Microburbs, 2006 - 2023
Kalbarri
54.8%
Kalbarri
54.8%
Regional WA
51.6%
Regional WA
51.6%
| Field | Value | VS Regional WA | Trend | |
|---|---|---|---|---|
| 94.8% | Top 39% |
|
||
| 5.2% | Bottom 39% |
|
||
| 25 | Bottom 24% | Data for Jun 2023 | ||
| $2,790 | Top 14% |
|
||
| 79 | Top 44% | Data for Jun 2023 | ||
| 81 | Top 20% | Data for Jun 2023 | ||
| 32.8% | Top 10% |
|
||
| 26.9% | Bottom 18% |
|
Housing Demand in Kalbarri
The higher the score, the more demand their is for housing in the area, both current and future.
Sources: ABS, TORREN, Property Listings and Microburbs, 2004 - 2030
Sources: ABS, TORREN, Property Listings and Microburbs, 2004 - 2030
Kalbarri
35.9%
Kalbarri
35.9%
Regional WA
40.5%
Regional WA
40.5%
| Field | Value | VS Regional WA | Trend | |
|---|---|---|---|---|
| Premium | Premium | Premium | ||
| Premium | Premium | Premium | ||
| 5310 | Bottom 17% |
|
||
| 58200 | Bottom 43% |
|
||
| Premium | Premium | Premium | ||
| 3040 | Bottom 24% |
|
||
| Premium | Premium | Premium | ||
| Premium | Premium | Premium | ||
| Premium | Premium | Premium | ||
| Premium | Premium | Premium |
Unit Market in Kalbarri
Sources: Property Listings and Microburbs, 2002 - 2023
| Field | Value | VS Regional WA | Trend | |
|---|---|---|---|---|
| Premium | Premium | Premium | ||
| $190 | Bottom 1% |
|
||
| Premium | Premium | Premium | ||
| 43.4% | Bottom 13% |
|
LGA Details (1)
| Headline | Place | Datetime |
|---|---|---|
| Local government area | Northampton |
Accommodation Options (28)
| Headline | Place | Datetime |
|---|---|---|
| Golden Chain Kalbarri Palm Resort | 8 Porter St | |
| Kalbarri Accommodation Services | 62 Grey St | |
| Kalbarri Beach Resort | Clotworthy St | |
| Kalbarri Coach Tours | Lot 174 Hackney St | |
| Kalbarri Edge Resort | 22 Porter St |
Realtors (1)
| Headline | Place | Datetime |
|---|---|---|
| Ray White Kalbarri | 62 Grey St |
Median Unit Sale Prices by Street (21)
| Date | Median sale value | Street |
|---|---|---|
| 29 Nov 2025 | $125,100 | Boronia Cct |
| 29 Nov 2025 | $161,200 | Calandrinia Ct |
| 29 Nov 2025 | $382,600 | Castaway St |
| 29 Nov 2025 | $184,000 | Clotworthy St |
| 29 Nov 2025 | $175,900 | Coral Bvd |
Median House Sale Prices by Street (10)
| Street | Date | Median sale value |
|---|---|---|
| Centrolepis Cct | 29 Nov 2025 | $509,700 |
| Chick Pl | 29 Nov 2025 | $636,300 |
| Darwinia Dr | 29 Nov 2025 | $350,500 |
| Diamond Vsta | 29 Nov 2025 | $639,700 |
| Gliddon Ave | 29 Nov 2025 | $666,900 |
Percent of Renters by Street (100)
| Percent of Renters | Street |
|---|---|
| 0.0% | Adair Cl |
| 100.0% | Ajana-Kalbarri Rd |
| 0.0% | Amber Vsta |
| 0.0% | Ash Pl |
| 0.0% | Atkinson Cr |
Turnover Rate by Street (100)
| Turnover rate | Street | Turnover Label | Turnover Years | Year |
|---|---|---|---|---|
| 25.0% | Red Bluff Rd | very tightly held | Every 40.0 years (very tightly held) | 2025 |
| 141.2% | Browne Bvd | very high turnover | Every 7.1 years (very high turnover) | 2025 |
| 107.9% | Gantheaume Cr | very high turnover | Every 9.3 years (very high turnover) | 2025 |
| 60.0% | Sequita Way | quite tightly held | Every 16.7 years (quite tightly held) | 2025 |
| 105.7% | Darwinia Dr | very high turnover | Every 9.5 years (very high turnover) | 2025 |
Recently Sold Houses (100)
| Address | Price | Bedrooms | Bathrooms | Garage spaces | Date sold | Subdivisible into | Sale Type |
|---|---|---|---|---|---|---|---|
| 7 Emerald Vista | $132,500 | 26 Nov 2025 | 0 | On Market | |||
| 14 Crocos Circuit | $860,000 | 4.0 | 2.0 | 6.0 | 20 Nov 2025 | 0 | On Market |
| 10 Tern Way | $240,000 | 19 Nov 2025 | 0 | On Market | |||
| 7 Explorer Ave | $377,500 | 18 Nov 2025 | 0 | On Market | |||
| 20 Glass St | Price Withheld | 4.0 | 2.0 | 6.0 | 10 Nov 2025 | 0 | On Market |
Businesses (30)
| Name | Address |
|---|---|
| Barker Transport Engineering | Unit 3 & 4/42 Atkinson Cres, Kalbarri WA 6536, Australia |
| Gantheaume Bay Electrical | 38 Gantheaume Cres, Kalbarri WA 6536, Australia |
| Mark Armstrong Electrical | 4 Mortimer St, Kalbarri WA 6536, Australia |
| kalbarri plumbing and gas | 107 Explorer Ave, Kalbarri WA 6536, Australia |
| Jetco Plumbing & Gas Services | Centrolepis Cct, Kalbarri WA 6536, Australia |
Recent Rental House Listings (100)
| Address | Rent (per week) | Bedrooms | Bathrooms | Garage spaces | Date | Subdivisible into |
|---|---|---|---|---|---|---|
| Unit 4, 124 Grey St | $600 | 2 | 2 | 1 | 13 Oct 2025 | 0 |
| Unit 4, 124 Grey St | $600 | 2 | 2 | 1 | 13 Oct 2025 | 0 |
| Unit 4, 124 Grey St | $600 | 2 | 2 | 1 | 13 Oct 2025 | 0 |
| Unit 4, 124 Grey St | $600 | 2 | 2 | 1 | 13 Oct 2025 | 0 |
| Unit 4, 124 Grey St | $600 | 2 | 2 | 1 | 13 Oct 2025 | 0 |
Recent Rental Unit Listings (100)
| Address | Rent (per week) | Bedrooms | Bathrooms | Garage spaces | Date |
|---|---|---|---|---|---|
| Unit 12, 35 Glass St | $490 | 2.0 | 0.0 | 13 Feb 2025 | |
| Unit 12, 35 Glass St | $490 | 2.0 | 0.0 | 13 Feb 2025 | |
| Unit 12, 35 Glass St | $490 | 2.0 | 0.0 | 13 Feb 2025 | |
| Unit 12, 35 Glass St | $490 | 2.0 | 0.0 | 13 Feb 2025 | |
| Unit 12, 35 Glass St | $490 | 2.0 | 0.0 | 13 Feb 2025 |
Recently Sold Units (100)
| Address | Price | Bedrooms | Bathrooms | Garage spaces | Date sold | Sale Type |
|---|---|---|---|---|---|---|
| 7 Emerald Vista | $132,500 | 26 Nov 2025 | On Market | |||
| 7 Explorer Ave | Price Withheld | 18 Nov 2025 | On Market | |||
| 7 Explorer Ave | Price Withheld | 18 Nov 2025 | On Market | |||
| 7 Explorer Ave | Price Withheld | 18 Nov 2025 | On Market | |||
| 26 Waitzia Way | $135,000 | 16 Oct 2025 | On Market |
Loading entities ..


Nearby Suburbs