.png)
Profiles
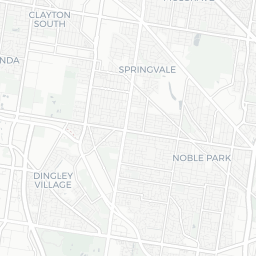
Nearby Suburbs
Springvale (Vic.): Diverse, busy, shopping, cemetery
Housing Market in Springvale (Vic.)

Sources: Property Listings, VIC RENTALS and Microburbs, 2000 - 2023
| Field | Value | VS Melbourne | Trend | |
|---|---|---|---|---|
| Premium | Premium | Premium | ||
| Premium | Premium | Premium | ||
| Premium | Premium | Premium | ||
| $674 | Top 28% |
|
||
| Premium | Premium | Premium |
Housing Supply in Springvale (Vic.)

The higher the supply score the more supply is on the market, both current and future.
Sources: ABS, GEOSPATIAL, Property Listings, PLANNING ALERTS, BASIX and Microburbs, 2002 - 2023
Sources: ABS, GEOSPATIAL, Property Listings, PLANNING ALERTS, BASIX and Microburbs, 2002 - 2023
Springvale (Vic.)
28.2%
Springvale (Vic.)
28.2%
Melbourne
28.8%
Melbourne
28.8%
| Field | Value | VS Melbourne | Trend | |
|---|---|---|---|---|
| 47.4 | Top 20% |
|
||
| 0.2 | Bottom 24% | Data for Jul 2023 | ||
| 60.4 | Top 11% | Data for May 2023 | ||
| Premium | Premium | Premium | ||
| Premium | Premium | Premium | ||
| Premium | Premium | Premium | ||
| 12 | Top 39% | Data for Dec 2020 | ||
| 71 lots | Top 3% |
|
||
| Premium | Premium | Premium | ||
| Premium | Premium | Premium | ||
| 48 | Top 2% |
|
Housing Stock Quality in Springvale (Vic.)
The higher the score, the higher the quality of the houses and units.
Sources: ABS, GEOSPATIAL, Property Listings, BASIX and Microburbs, 2006 - 2023
Sources: ABS, GEOSPATIAL, Property Listings, BASIX and Microburbs, 2006 - 2023
| Field | Value | VS Melbourne | Trend | |
|---|---|---|---|---|
| 70.3% | Bottom 8% |
|
||
| 2.9 | Top 17% | Data for Jan 2021 | ||
| 25.4% | Top 11% | Data for Jun 2023 |
Development Restrictions in Springvale (Vic.)

The higher the score, the more easily density can be increased.
Sources: GEOSPATIAL, TORREN, ABS and Microburbs, 2011 - 2023
Sources: GEOSPATIAL, TORREN, ABS and Microburbs, 2011 - 2023
Springvale (Vic.)
34.4%
Springvale (Vic.)
34.4%
Melbourne
36.9%
Melbourne
36.9%
| Field | Value | VS Melbourne | Trend | |
|---|---|---|---|---|
| 8.3 sq km | Top 49% | Data for Jan 2021 | ||
| 3.4 sq km | Top 3% | Data for Jun 2023 | ||
| 285 sqm per resident | Bottom 8% | Data for Jan 2021 |
Risk in Springvale (Vic.)

The higher the score, the more exposed households are to financial stress.
Sources: ABS, Property Listings, TORREN and Microburbs, 2006 - 2023
Sources: ABS, Property Listings, TORREN and Microburbs, 2006 - 2023
Springvale (Vic.)
58.3
Springvale (Vic.)
58.3
Melbourne
49.7
Melbourne
49.7
| Field | Value | VS Melbourne | Trend | |
|---|---|---|---|---|
| 71.7% | Bottom 7% |
|
||
| 28.3% | Top 7% |
|
||
| 64 | Top 5% | Data for Jun 2023 | ||
| $1,720 | Bottom 38% |
|
||
| 66 | Bottom 6% | Data for Jun 2023 | ||
| 57 | Bottom 2% | Data for Jun 2023 | ||
| 28.7% | Top 19% |
|
||
| 24.8% | Bottom 14% |
|
Housing Demand in Springvale (Vic.)
The higher the score, the more demand their is for housing in the area, both current and future.
Sources: ABS, TORREN, Property Listings and Microburbs, 1975 - 2030
Sources: ABS, TORREN, Property Listings and Microburbs, 1975 - 2030
Springvale (Vic.)
89.1%
Springvale (Vic.)
89.1%
Melbourne
82.9%
Melbourne
82.9%
| Field | Value | VS Melbourne | Trend | |
|---|---|---|---|---|
| Premium | Premium | Premium | ||
| Premium | Premium | Premium | ||
| 28400 | Top 4% |
|
||
| 201000 | Top 3% |
|
||
| Premium | Premium | Premium | ||
| 209000 | Top 6% |
|
||
| Premium | Premium | Premium | ||
| Premium | Premium | Premium | ||
| Premium | Premium | Premium | ||
| Premium | Premium | Premium |
Unit Market in Springvale (Vic.)
Sources: Property Listings, VIC RENTALS and Microburbs, 2000 - 2023
| Field | Value | VS Melbourne | Trend | |
|---|---|---|---|---|
| Premium | Premium | Premium | ||
| $542 | Top 34% |
|
||
| Premium | Premium | Premium | ||
| 89.5% | Top 19% |
|
Median House Rental Prices by Street (83)
| Street | Date | Median rent (per week) |
|---|---|---|
| Flynn St | 22 Mar 2025 | $675 |
| Fairview St | 22 Mar 2025 | $550 |
| Glendale Rd | 22 Mar 2025 | $470 |
| Garnsworthy St | 22 Mar 2025 | $530 |
| Donald St | 22 Mar 2025 | $490 |
LGA Details (1)
| Headline | Place | Datetime |
|---|---|---|
| Local government area | Greater Dandenong |
Planning Applications: Dwellings (22)
| Headline | Place | Date |
|---|---|---|
| This proposal seeks to formally subdivide an approved development permit for construction of two (2) double storey dwellings (PLN22/0145). An application to subdivide land with an approved development into two lots and common property is being sought. - Streamlined Planning through Electronic Applications and Referrals S245083M | Albert Avenue, Springvale VIC 3171 | 11 Mar 2025 |
| The proposal is a 4 Lot Subdivision of existing dwellings. The Planning Permit was issued on 20/09/89 and as such, this development is exempt from a Public Open Space Contribution as detailed in Clause 53.01-1 in the Greater Dandenong Planning Scheme. - Streamlined Planning through Electronic Applications and Referrals S244214A | 1/21 Royal Avenue, Springvale VIC 3171 | 21 Feb 2025 |
| Subdivision of Land into Three Lots, to be generally in accordance with the approved Development Permit / Plans. *Please include a condition in the permit to allow the subdivision to be carried out prior to building or alongside construction. As per Amendment VC221 gazetted on 4th August 2022. We wish to advise that this development will be connected to reticulated gas. - Streamlined Planning through Electronic Applications and Referrals S237425A | 2 Edmond Street, Springvale VIC 3171 | 28 Nov 2024 |
| To subdivide the land into three lots prior to construction of the new dwellings. A Section 173 Agreement will be required. - Streamlined Planning through Electronic Applications and Referrals S240188M | 27 Virginia Street, Springvale VIC 3171 | 27 Nov 2024 |
| To subdivide the land into three lots, with each lot to contain one dwelling. - Streamlined Planning through Electronic Applications and Referrals S238564E | 4 Princess Avenue, Springvale VIC 3171 | 26 Oct 2024 |
Planning Applications: Industrial (1)
| Headline | Place | Date |
|---|---|---|
| Subdivide land into 3 Lots, with each lot containing an existing warehouse. - Streamlined Planning through Electronic Applications and Referrals S225493V | 2-6 Mcwilliam Street, Springvale VIC 3171 | 14 Mar 2024 |
Planning Applications: Other (47)
| Headline | Place | Date |
|---|---|---|
| Removal of part of the easement shown blue on TP456763M as created in Inst.2317018 to the position shown on this plan. Removal of the easement shown green on TP456763M as created in Inst.2317018 - Streamlined Planning through Electronic Applications and Referrals S217948C | 242 Springvale Road, Springvale VIC 3171 | 30 Aug 2023 |
| Restaurant and cafe Licence for a Company - Victorian Gambling and Casino Control Commission 71888A01 | 4A Windsor Av, Springvale 3171, VIC | 07 Sep 2022 |
| Restaurant and cafe Licence for a Company - Victorian Gambling and Casino Control Commission 71866A01 | 215 Springvale Rd, Springvale 3171, VIC | 03 Sep 2022 |
| App.Online - Transfer of licence to Person - Victorian Gambling and Casino Control Commission 69106A02 | 12A Balmoral Ave, Springvale 3171, VIC | 23 Aug 2022 |
| Restaurant and cafe Licence for a Company - Victorian Gambling and Casino Control Commission 71810A01 | Unit 2 288 Springvale Rd, Springvale 3171, VIC | 23 Aug 2022 |
Turnover Rate by Street (100)
| Turnover rate | Street | Turnover Label | Turnover Years | Year |
|---|---|---|---|---|
| 65.0% | Whitworth Ave | quite tightly held | Every 15.4 years (quite tightly held) | 2025 |
| 21.4% | Tricia Ave | very tightly held | Every 46.7 years (very tightly held) | 2025 |
| 75.8% | Grace St | average turnover | Every 13.2 years (average turnover) | 2025 |
| 72.3% | Stephenson St | average turnover | Every 13.8 years (average turnover) | 2025 |
| 142.3% | Watt St | very high turnover | Every 7.0 years (very high turnover) | 2025 |
Median House Sale Prices by Street (100)
| Street | Date | Median sale value |
|---|---|---|
| Metylene Ave | 10 May 2024 | $767,500 |
| Lenore St | 10 May 2024 | $887,000 |
| Loller St | 10 May 2024 | $730,000 |
| Mary St | 10 May 2024 | $600,000 |
| Mein St | 10 May 2024 | $850,000 |
Median Unit Sale Prices by Street (100)
| Date | Median sale value | Street |
|---|---|---|
| 10 May 2024 | $503,800 | Lewis St |
| 10 May 2024 | $299,000 | Kelvin Gr |
| 10 May 2024 | $1,200,000 | Kelly Ct |
| 10 May 2024 | $1,050,000 | Lightwood Rd |
| 10 May 2024 | $450,000 | Princes Hwy |
Recently Sold Houses (100)
| Address | Price | Bedrooms | Bathrooms | Garage spaces | Date sold | Subdivisible into | Sale Type |
|---|---|---|---|---|---|---|---|
| 6 Eden Ave | $800,000 | 4.0 | 1.0 | 3.0 | 20 Mar 2025 | 0 | On Market |
| 20 Joyce St | Price Withheld | 3.0 | 1.0 | 2.0 | 19 Mar 2025 | 0 | On Market |
| 791 Heatherton Rd | $780,000 | 3.0 | 1.0 | 2.0 | 18 Mar 2025 | 0 | On Market |
| 43 Phillip Ave | $749,000 | 4.0 | 1.0 | 1.0 | 15 Mar 2025 | 0 | On Market |
| 12 Emerald Dr | $939,000 | 3.0 | 3.0 | 4.0 | 14 Mar 2025 | 0 | On Market |
Businesses (100)
| Name | Address |
|---|---|
| Balcross Pty Ltd | 1/56 Smith Rd, Springvale VIC 3171, Australia |
| 8con | a4/2A Westall Rd, Springvale VIC 3171, Australia |
| Pascuzzi Construction | 1640 Centre Rd, Springvale VIC 3171, Australia |
| EGBC PTY LTD | 56 Victoria Ave, Springvale VIC 3171, Australia |
| JBR Building Constructions | 49 Albert Ave, Springvale VIC 3171, Australia |
Percent of Renters by Street (100)
| Percent of Renters | Street |
|---|---|
| 34.8% | Acacia Mews |
| 56.0% | Adrian St |
| 55.7% | Albert Ave |
| 56.9% | Alma Ct |
| 50.2% | Amaryn Ct |
Recent Rental Unit Listings (100)
| Address | Rent (per week) | Bedrooms | Bathrooms | Garage spaces | Date |
|---|---|---|---|---|---|
| Unit 3, 27-29 Ellen St | $500 | 2.0 | 1.0 | 1.0 | 18 Mar 2025 |
| Unit 10, 3 Ashdale Ct | $350 | 1.0 | 1.0 | 1.0 | 17 Mar 2025 |
| Unit 10, 3 Ashdale Ct | $350 | 1.0 | 1.0 | 1.0 | 17 Mar 2025 |
| Unit 10, 3 Ashdale Ct | $350 | 1.0 | 1.0 | 1.0 | 17 Mar 2025 |
| Unit 3, 42 Moncur Ave | $550 | 2.0 | 1.0 | 1.0 | 13 Mar 2025 |
Recent Rental House Listings (100)
| Address | Rent (per week) | Bedrooms | Bathrooms | Garage spaces | Date | Subdivisible into |
|---|---|---|---|---|---|---|
| 12 Mein St | $700 | 3 | 2 | 2 | 19 Mar 2025 | 0 |
| 68 Garnsworthy St | $550 | 3 | 1 | 1 | 19 Mar 2025 | 0 |
| Unit 1, 68 Albert Ave | $660 | 3 | 2 | 1 | 19 Mar 2025 | 0 |
| 12 Mein St | $700 | 3 | 2 | 2 | 19 Mar 2025 | 0 |
| 68 Garnsworthy St | $550 | 3 | 1 | 1 | 19 Mar 2025 | 0 |
Recently Sold Units (100)
| Address | Price | Bedrooms | Bathrooms | Garage spaces | Date sold | Sale Type |
|---|---|---|---|---|---|---|
| 27 Orana Way | $719,500 | 3.0 | 2.0 | 2.0 | 20 Mar 2025 | On Market |
| 27 Orana Way | $719,500 | 3.0 | 2.0 | 2.0 | 20 Mar 2025 | On Market |
| 27 Orana Way | $719,500 | 3.0 | 2.0 | 2.0 | 20 Mar 2025 | On Market |
| Unit 3, 10 Whiteside St | $647,000 | 3.0 | 2.0 | 1.0 | 18 Mar 2025 | On Market |
| Unit 6, 17-23 Gunther Ave | $690,000 | 3.0 | 1.0 | 2.0 | 18 Mar 2025 | On Market |
Loading entities ..