.png)
Profiles
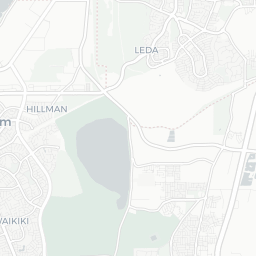
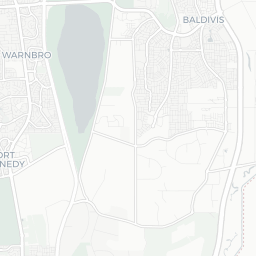
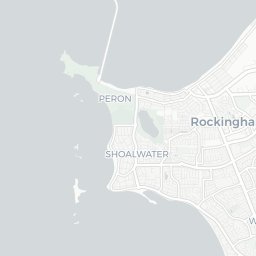
Nearby Suburbs
Real Estate Market: Is Waikiki WA 6169 a Good Suburb to Buy Into?
Housing Market in Waikiki

Sources: Property Listings and Microburbs, 2002 - 2023
| Field | Value | VS Perth | Trend | |
|---|---|---|---|---|
| Premium | Premium | Premium | ||
| Premium | Premium | Premium | ||
| Premium | Premium | Premium | ||
| $646 | Top 39% |
|
||
| Premium | Premium | Premium |
Housing Supply in Waikiki

The higher the supply score the more supply is on the market, both current and future.
Sources: ABS, GEOSPATIAL, Property Listings, PLANNING ALERTS and Microburbs, 2002 - 2023
Sources: ABS, GEOSPATIAL, Property Listings, PLANNING ALERTS and Microburbs, 2002 - 2023
Waikiki
23.5%
Waikiki
23.5%
Perth
38.0%
Perth
38.0%
| Field | Value | VS Perth | Trend | |
|---|---|---|---|---|
| 0 | Bottom 38% | Data for Jun 2025 | ||
| 0.0 | Bottom 10% | Data for Jul 2023 | ||
| 14.7 | Top 24% | Data for May 2023 | ||
| Premium | Premium | Premium | ||
| Premium | Premium | Premium | ||
| Premium | Premium | Premium | ||
| Premium | Premium | Premium | ||
| Premium | Premium | Premium | ||
| 25 | Top 6% |
|
Housing Stock Quality in Waikiki
The higher the score, the higher the quality of the houses and units.
Sources: ABS, GEOSPATIAL, Property Listings and Microburbs, 2006 - 2023
Sources: ABS, GEOSPATIAL, Property Listings and Microburbs, 2006 - 2023
| Field | Value | VS Perth | Trend | |
|---|---|---|---|---|
| 97.8% | Bottom 33% |
|
||
| 2.6 | Top 39% |
|
||
| 49.7% | Top 7% | Data for Jun 2023 |
Development Restrictions in Waikiki

The higher the score, the more easily density can be increased.
Sources: GEOSPATIAL, TORREN, ABS and Microburbs, 2011 - 2023
Sources: GEOSPATIAL, TORREN, ABS and Microburbs, 2011 - 2023
Waikiki
29.1%
Waikiki
29.1%
Perth
34.5%
Perth
34.5%
| Field | Value | VS Perth | Trend | |
|---|---|---|---|---|
| 7.8 sq km | Top 50% | Data for Jan 2021 | ||
| 481 sqm per resident | Bottom 27% | Data for Jan 2021 |
Risk in Waikiki

The higher the score, the more exposed households are to financial stress.
Sources: ABS, Property Listings, TORREN and Microburbs, 2006 - 2023
Sources: ABS, Property Listings, TORREN and Microburbs, 2006 - 2023
Waikiki
50.0
Waikiki
50.0
Perth
47.5
Perth
47.5
| Field | Value | VS Perth | Trend | |
|---|---|---|---|---|
| 87.4% | Bottom 34% | 0 to May 2023 | ||
| 12.6% | Top 34% |
|
||
| 25 | Bottom 23% | Data for Jun 2023 | ||
| $2,440 | Top 25% |
|
||
| 81 | Top 36% | Data for Jun 2023 | ||
| 77 | Top 45% | Data for Jun 2023 | ||
| 22.8% | Top 46% |
|
||
| 52.8% | Top 16% |
|
Housing Demand in Waikiki
The higher the score, the more demand their is for housing in the area, both current and future.
Sources: ABS, TORREN, Property Listings and Microburbs, 2004 - 2030
Sources: ABS, TORREN, Property Listings and Microburbs, 2004 - 2030
Waikiki
62.9%
Waikiki
62.9%
Perth
71.6%
Perth
71.6%
| Field | Value | VS Perth | Trend | |
|---|---|---|---|---|
| Premium | Premium | Premium | ||
| 12400 | Top 46% |
|
||
| 149000 | Top 12% |
|
||
| Premium | Premium | Premium | ||
| 162000 | Top 11% |
|
||
| Premium | Premium | Premium | ||
| Premium | Premium | Premium | ||
| Premium | Premium | Premium | ||
| Premium | Premium | Premium |
Unit Market in Waikiki
Sources: Property Listings and Microburbs, 2002 - 2023
| Field | Value | VS Perth | Trend | |
|---|---|---|---|---|
| Premium | Premium | Premium | ||
| $500 | Bottom 46% |
|
||
| Premium | Premium | Premium | ||
| 67.2% | Bottom 43% |
|
LGA Details (1)
| Headline | Place | Datetime |
|---|---|---|
| Local government area | Rockingham |
Median House Rental Prices by Street (45)
| Level_0 | Street | Date | Median rent (per week) |
|---|---|---|---|
| 149059 | Fairview Dr | 30 Mar 2025 | $650 |
| 149068 | Fendam St | 30 Mar 2025 | $600 |
| 149056 | Eyre St | 30 Mar 2025 | $575 |
| 149026 | Dunham Rtt | 30 Mar 2025 | $627 |
| 149206 | Hope Pl | 30 Mar 2025 | $587 |
Realtors (1)
| Headline | Place | Datetime |
|---|---|---|
| Summit Realty | Shop 20 Waikiki Village Shopping Centre |
Percent of Renters by Street (100)
| Percent of Renters | Street |
|---|---|
| 29.8% | Abalone Cr |
| 18.9% | Abbeytown Circle |
| 6.0% | Aldinga Pl |
| 0.0% | Alston Cl |
| 14.3% | Ambleside Pde |
Turnover Rate by Street (100)
| Turnover rate | Street | Turnover Label | Turnover Years | Year |
|---|---|---|---|---|
| 40.0% | Java Pl | very tightly held | Every 25.0 years (very tightly held) | 2025 |
| 96.1% | Burnside Way | high turnover | Every 10.4 years (high turnover) | 2025 |
| 62.5% | Compass Pl | quite tightly held | Every 16.0 years (quite tightly held) | 2025 |
| 71.4% | Dundas Ct | average turnover | Every 14.0 years (average turnover) | 2025 |
| 72.9% | Jubilee Dr | average turnover | Every 13.7 years (average turnover) | 2025 |
Median Unit Sale Prices by Street (100)
| Date | Median sale value | Street |
|---|---|---|
| 10 May 2024 | $765,000 | Warnbro Beach Rd |
| 10 May 2024 | $420,000 | Shoalhaven Pl |
| 10 May 2024 | $365,000 | Gnangara Dr |
| 10 May 2024 | $418,800 | Bolsabay Dr |
| 25 Apr 2024 | $380,000 | Virginia Pl |
Median House Sale Prices by Street (100)
| Street | Date | Median sale value |
|---|---|---|
| Fendam St | 10 May 2024 | $300,000 |
| Castlerock Ave | 10 May 2024 | $558,200 |
| Cowrie Ct | 10 May 2024 | $659,000 |
| Cumberland | 10 May 2024 | $630,000 |
| Buttermere App | 10 May 2024 | $481,200 |
Businesses (35)
| Name | Address |
|---|---|
| W B Fencing | 41 Virginia Pl, Waikiki WA 6169, Australia |
| Waikiki Roof Tiles | 144 Warnbro Beach Rd, Waikiki WA 6169, Australia |
| Real Plumbing and Gas PTY LTD | 6 Investigator Dr, Waikiki WA 6169, Australia |
| Summit Realty | Shop 20 Waikiki Village Shopping Centre, Waikiki WA 6169, Australia |
| Real Plumbing And Gas |
Accommodation Options (2)
| Name | Address |
|---|---|
| Dr. Hairul Ahmad | 12/221 Willmott Dr, Waikiki WA 6169, Australia |
| Waikiki Beach Bed and Breakfast | 575 Safety Bay Rd, Waikiki WA 6169, Australia |
Planning Applications: Dwellings (1)
| Headline | Place | Date |
|---|---|---|
| DP/14/0006620.2013.388.133 Single & Double Storey Grouped DwellingsLot 1131 (56) Westlinton Circle, Waikiki - Development Assessment Panels 475 | Lot 1131 (56) Westlinton Circle, Waikiki, WA | 15 Jan 2014 |
Recently Sold Houses (100)
| Address | Price | Bedrooms | Bathrooms | Garage spaces | Date sold | Subdivisible into | Sale Type |
|---|---|---|---|---|---|---|---|
| 6 Reliance Ct | $735,000 | 3.0 | 2.0 | 2.0 | 14 Mar 2025 | 0 | On Market |
| 26 Fendam St | $950,000 | 3.0 | 2.0 | 4.0 | 14 Mar 2025 | 0 | On Market |
| 10 Colville St | Price Withheld | 4.0 | 2.0 | 2.0 | 12 Mar 2025 | 0 | On Market |
| 10 Colville St | $730,000 | 4.0 | 2.0 | 2.0 | 12 Mar 2025 | 0 | On Market |
| 93 Gascoyne Way | $600,000 | 3.0 | 1.0 | 2.0 | 12 Mar 2025 | 0 | On Market |
Recent Rental Unit Listings (100)
| Address | Rent (per week) | Bedrooms | Bathrooms | Garage spaces | Date |
|---|---|---|---|---|---|
| Unit 4, 56 Westlinton Circle | $580 | 3.0 | 2.0 | 2.0 | 08 Jan 2025 |
| Unit 4, 56 Westlinton Circle | $580 | 3.0 | 2.0 | 2.0 | 08 Jan 2025 |
| Unit 4, 56 Westlinton Circle | $580 | 3.0 | 2.0 | 2.0 | 08 Jan 2025 |
| Unit 4, 56 Westlinton Circle | $580 | 3.0 | 2.0 | 2.0 | 08 Jan 2025 |
| Unit 4, 56 Westlinton Circle | $580 | 3.0 | 2.0 | 2.0 | 08 Jan 2025 |
Recent Rental House Listings (100)
| Address | Rent (per week) | Bedrooms | Bathrooms | Garage spaces | Date | Subdivisible into |
|---|---|---|---|---|---|---|
| 4 Prevelly Circle | $600 | 4 | 2 | 2 | 28 Mar 2025 | 0 |
| 4 Prevelly Circle | $600 | 4 | 2 | 2 | 28 Mar 2025 | 0 |
| 2 Gidgi Way | $680 | 4 | 2 | 2 | 24 Mar 2025 | 0 |
| 2 Gidgi Way | $680 | 4 | 2 | 2 | 24 Mar 2025 | 0 |
| 24 Ravenglass Cr | $700 | 4 | 2 | 2 | 24 Mar 2025 | 0 |
Recently Sold Units (100)
| Address | Price | Bedrooms | Bathrooms | Garage spaces | Date sold | Sale Type |
|---|---|---|---|---|---|---|
| Unit 2, 25 Lonsdale Cr | $548,000 | 3.0 | 2.0 | 2.0 | 27 Mar 2025 | On Market |
| Unit 2, 25 Lonsdale Cr | $548,000 | 3.0 | 2.0 | 2.0 | 27 Mar 2025 | On Market |
| Unit 2, 25 Lonsdale Cr | $548,000 | 3.0 | 2.0 | 2.0 | 27 Mar 2025 | On Market |
| Unit 5, 27 Lonsdale Cr | $583,000 | 3.0 | 2.0 | 0.0 | 14 Feb 2025 | On Market |
| Unit 5, 27 Lonsdale Cr | $583,000 | 3.0 | 2.0 | 0.0 | 14 Feb 2025 | On Market |
Loading entities ..